August 20, 2026
The Federal Workforce Shrunk by 286,000. DOGE's Savings Are Harder to Prove
FederalHiringData finds a 12.4% workforce contraction and an estimated $24.7 billion decline in annualized basic pay, while the public savings ledger remains incomplete.
By Evan Mercer
Published August 20, 2026Last edited August 20, 2026

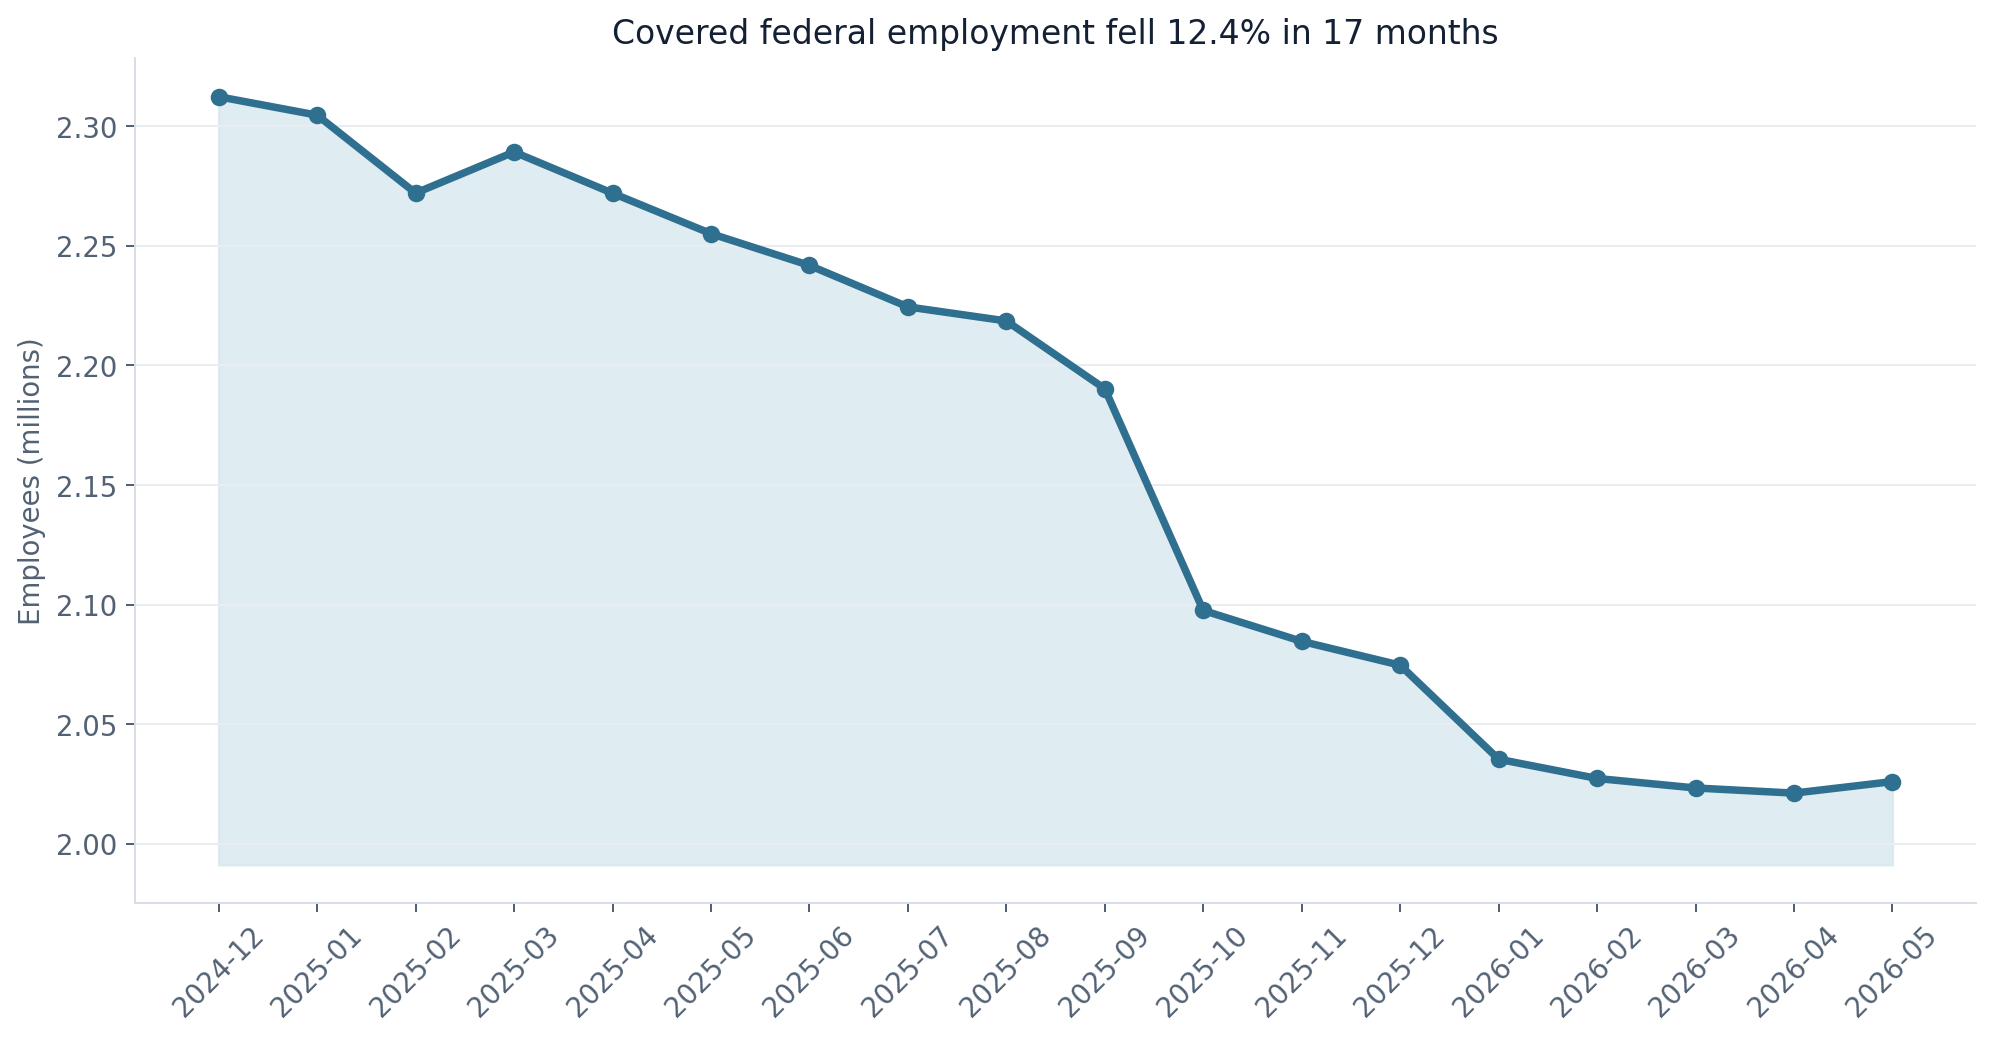
By May 2026, the federal government's covered civilian workforce was 286,308 employees smaller than it had been in December 2024. Nearly one worker in eight had disappeared from the count in 17 months.
That is the clearest result of the restructuring associated with the Department of Government Efficiency and the Trump administration's workforce orders. It is visible in the Office of Personnel Management's monthly records, not inferred from a press release. The contraction nearly matched the numerical scale of the federal downsizing from 1992 through 1996, but unfolded in less than half the time.
The accounting becomes less certain after headcount. FederalHiringData estimates that annualized adjusted basic pay attached to the covered workforce fell by about $24.7 billion, even as average reported pay rose. The official DOGE site claims $215 billion in savings, but its current contract, grant and lease receipts itemize $110.3 billion. The Government Accountability Office found that much of the receipt methodology could not be reproduced from the supporting records.
The restructuring changed more than a payroll total. From January 2025 through May 2026, 467,286 people separated from covered federal employment while 196,499 entered. Those departing workers carried about 6.50 million recorded years of federal service. Hiring announcements collapsed, including entry-grade announcements. Managers and supervisors did not shrink as fast as the workforce overall. Contract obligations rose in fiscal 2025.
This leaves a split verdict. The government became meaningfully smaller by employee count, and its estimated basic-pay commitment fell. Some contracts, grants, leases and regulations were cancelled or changed. But the public record does not yet establish the full claimed savings, a governmentwide net after implementation costs, or whether diminished capacity will create future costs.
What does the scorecard actually prove?
| Dimension | Before | Latest | Change | What the evidence supports |
|---|---|---|---|---|
| Covered civilian workforce | 2,312,301 | 2,025,993 | -286,308 (-12.4%) | Verified workforce contraction |
| Annualized adjusted-basic-pay roll | $262.4B | $237.7B | -$24.7B (-9.4%) | FederalHiringData estimate, not audited outlays |
| Average adjusted basic pay | $113,486 | $117,338 | +3.4% | Smaller workforce, higher average pay |
| USAJOBS announcements opened | 366,628 in 2024 | 146,684 in 2025 | -60.0% | Recruiting fell; announcements are not hires |
| Contract obligations | $741.0B in FY2024 | $778.4B in FY2025 | +5.1% | Nominal obligations rose |
| Final-rule documents | 3,248 in 2024 | 2,441 in 2025 | -24.8% | Rule count fell; burden and benefit are unmeasured |
| DOGE headline savings | — | $215B claimed | — | Attributed claim, not independently reproduced |
| DOGE itemized receipts | — | $110.3B | 51.3% of claim | Itemized, not necessarily realized or recurring |
| Comparable post-DOGE federal lease footprint | — | Not available | Unknown | Latest governmentwide FRPP summary is FY2024 |
| Verified net recurring savings | — | No complete ledger | Unknown | Implementation and reversal costs are incomplete |
The uneven answers matter. Headcount is a stock that OPM counts monthly. Contract obligations are transactions in a spending system. A lease's maximum face value is not necessarily avoidable rent. A regulation's word count is not its economic effect. Adding them into one number without preserving those distinctions makes the total look more precise than the evidence.
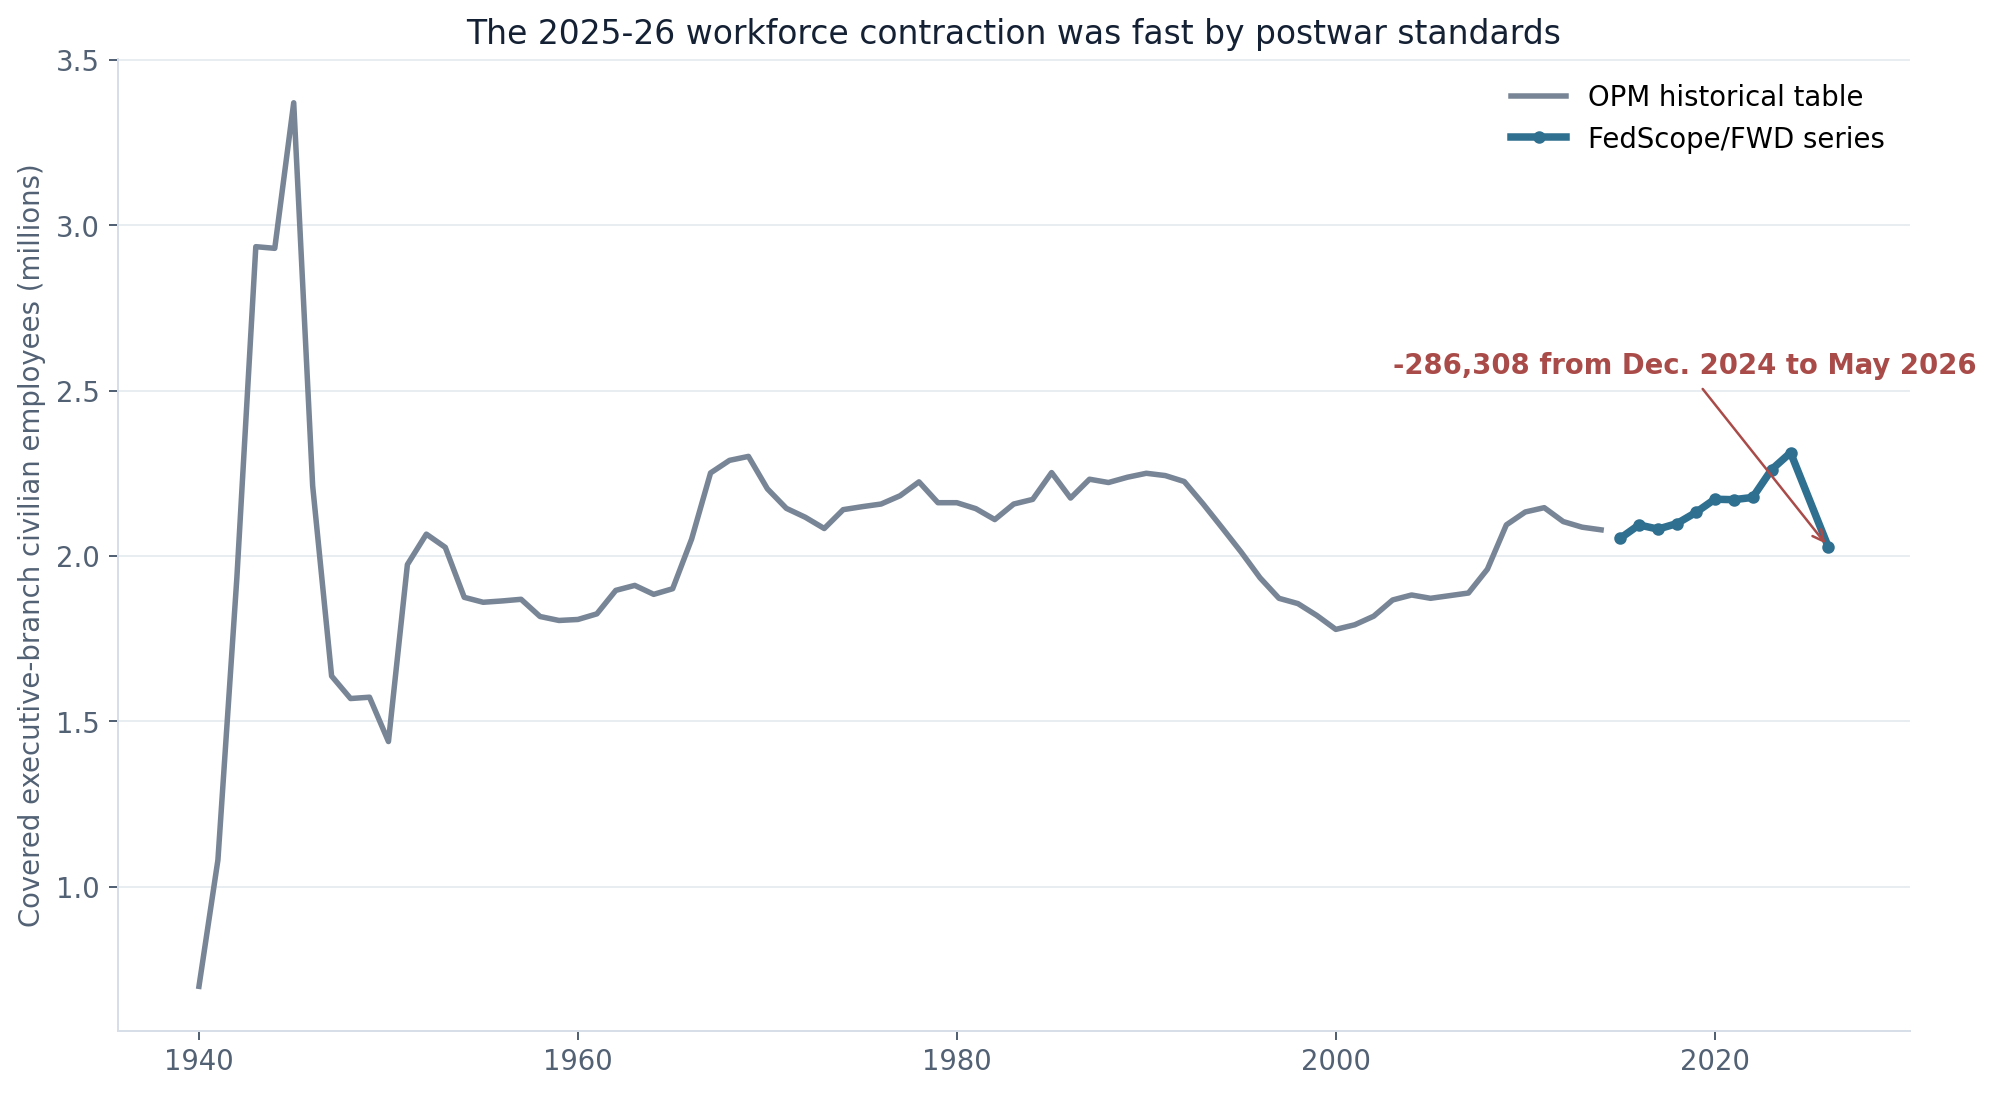
How unusual was a 1990s-scale decline in 17 months?
OPM's long historical table shows that executive-branch civilian employment fell from 2.225 million in fiscal 1992 to 1.934 million in 1996, a decline of about 291,000 over four years. It reached 1.856 million in 1998 and 1.778 million in 2000. That post-Cold War downsizing was larger when measured from its early-1990s peak to its endpoint, but it was gradual.
The current monthly series fell from 2,312,301 in December 2024 to 2,025,993 in May 2026. The difference was 286,308, or 12.4%, in 17 months. It took the recent contraction roughly one-third as long to approach the size of the 1992–1996 decline.
This is a comparison of speed and scale, not a declaration that the recent change set one clean all-time record. The historical OPM table reports end-of-fiscal-year executive-branch totals. The newer Federal Workforce Data series is monthly and has somewhat different coverage. The chart preserves that break instead of pretending the observations are identical.
The path was not a straight line. Headcount fell sharply after September 2025, moved down more slowly in early 2026 and then rose by 4,826 in May. Accessions also recovered to 24,395 that month, the highest monthly value in the 17-month comparison. That late movement is evidence of stabilization, not yet a rebuilding trend.
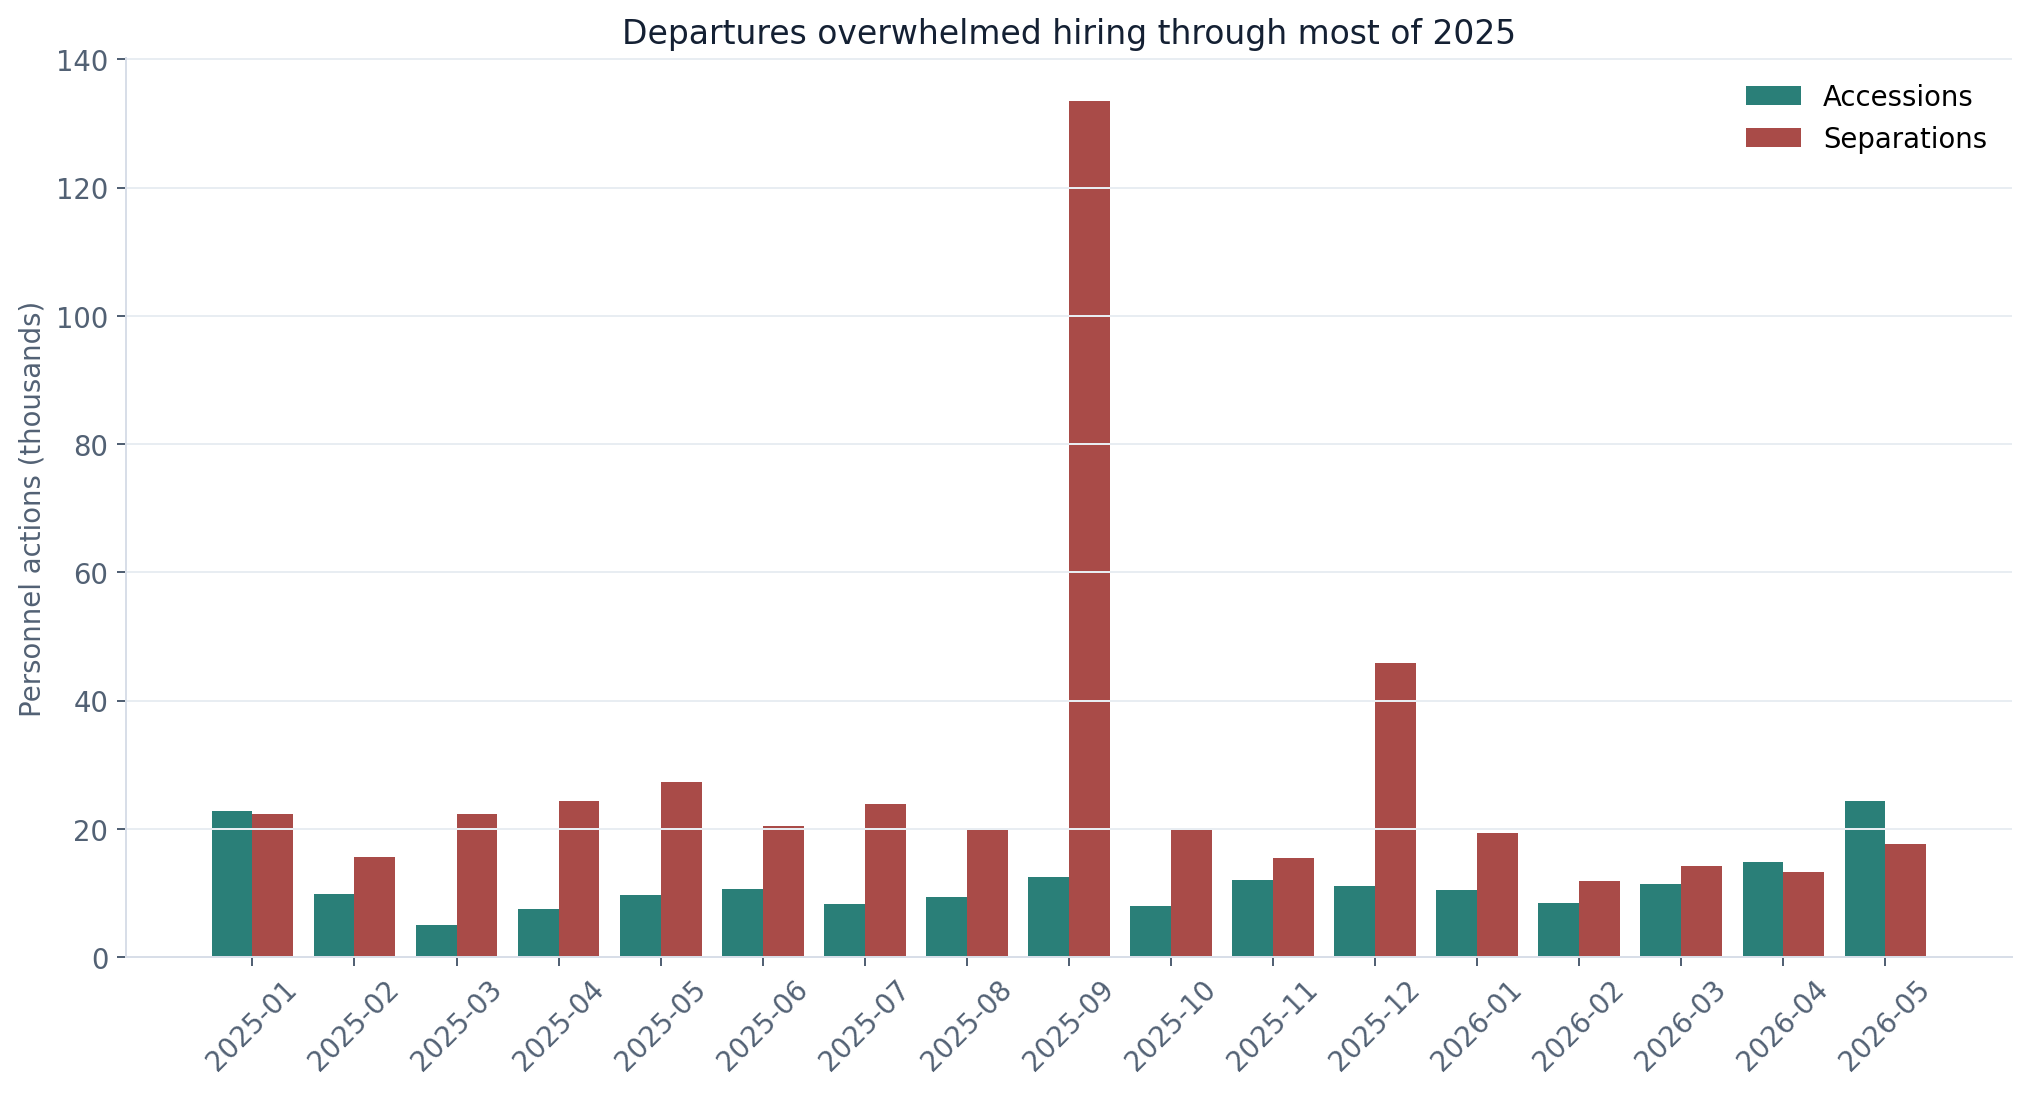
Did the government stop replacing people as they left?
The contraction was produced by more than layoffs. OPM records 467,286 separations from January 2025 through May 2026 and 196,499 accessions. Quits accounted for 198,016 separations, retirements for 173,348 and termination or expired-appointment actions for 46,354. Reductions in force accounted for 10,850. Categories can reflect legal personnel actions rather than the story an employee would use to describe a departure.
Deferred resignation is especially easy to double count. OPM flags 140,345 separations associated with the program, but that flag overlaps retirement, quit and other action categories. It is not an additional block to add to the total. GAO's agency survey similarly found that 22 major agencies reported nearly 378,000 separations and about 127,000 hires during 2025, with 65% of the separations occurring in the second half as deferred resignations took effect.
| Personnel-flow measure | Jan. 2025–May 2026 | Interpretation |
|---|---|---|
| Accessions | 196,499 | Entries into covered employment |
| Separations | 467,286 | All recorded exits |
| Net accessions minus separations | -270,787 | Flow measure, not identical to point-in-time change |
| Quits | 198,016 | OPM separation category |
| Retirements | 173,348 | OPM retirement actions |
| Termination / expired appointment | 46,354 | Includes multiple personnel-action circumstances |
| Reduction-in-force actions | 10,850 | Formal RIF category |
| Deferred-resignation flagged | 140,345 | Overlaps other separation categories |
The most intense month was September 2025. OPM recorded 133,470 separations and 12,481 accessions, a net flow of -120,989. Another 45,860 separations occurred in December. By contrast, March 2025 had only 4,969 accessions.
The annual context is also unusual. The 126,969 accessions recorded in 2025 were the lowest complete-year value in FederalHiringData's locally comparable OPM series beginning in 2005. The 390,934 separations were the highest. The administration's workforce optimization order called for no more than one hire for every four departures in covered areas, subject to exceptions. The observed pattern is consistent with a policy that relied heavily on attrition and constrained replacement.
How much federal experience left?
OPM's separation files include length of service. Multiplying the public count attached to each separation row by that reported value yields 6,501,053 years of federal service associated with departures from January 2025 through May 2026. Only 220 separation records lacked a usable service value.
Nearly half of the separations, 226,463, involved at least 10 years of service. Some 141,704 involved at least 20 years and 67,437 at least 30 years. This is not a dollar value, and it does not mean every year disappeared permanently. Agencies can document work, transfer knowledge, rehire and reorganize. Nor does the calculation show that DOGE caused every departure. It measures the experience carried by the people who left during the period.
The age pattern presents a second succession problem. Covered workers under age 30 fell from 202,425 to 164,369, down 18.8%. Workers age 60 or older fell from 355,988 to 290,694, down 18.3%. Both groups contracted faster than the workforce as a whole. Older departures can remove deep institutional memory while fewer younger workers narrow the replacement pipeline.
One agency illustrates the risk. GAO reported in July 2026 that OPM itself lost 35% of its staff from December 2024 through March 2026, eliminated 10 offices and saw 57% of departing employees leave with at least 11 years of service. OPM is the agency expected to guide the rest of government through human-capital planning.
That does not prove a service failure. It establishes the condition under which one could emerge. GAO has made the same distinction at FEMA: staff cuts made without a workforce analysis or strategy may affect readiness, but future disaster outcomes cannot be assigned in advance.
Did the cuts mainly remove bureaucracy?
The largest occupation declines include exactly the administrative series that a bureaucracy-reduction campaign might target. Miscellaneous administration and program work fell by 24,934. Management and program analysis fell by 20,917. Miscellaneous clerical and assistant work fell by 11,227, HR by 7,129 and contracting by 7,086.
But the reductions were not confined to overhead. IT management fell by 17,730, attorneys by 7,982, contact representatives by 7,941, financial administration by 5,216, general engineering by 5,048, natural-resources and biological-science work by 4,749, compliance inspection and support by 4,749, nurses by 4,355 and medical officers by 3,252.
| Occupational series | Dec. 2024 | May 2026 | Change |
|---|---|---|---|
| 0301 Administration and program | 114,470 | 89,536 | -24,934 |
| 0343 Management and program analysis | 98,378 | 77,461 | -20,917 |
| 2210 Information technology management | 102,085 | 84,355 | -17,730 |
| 0303 Clerk and assistant | 46,941 | 35,714 | -11,227 |
| 0905 Attorney | 44,626 | 36,644 | -7,982 |
| 0962 Contact representative | 37,734 | 29,793 | -7,941 |
| 0201 Human resources management | 42,585 | 35,456 | -7,129 |
| 1102 Contracting | 44,606 | 37,520 | -7,086 |
| 0801 General engineering | 34,778 | 29,730 | -5,048 |
| 0610 Nurse | 110,486 | 106,131 | -4,355 |
Nor did formal management bear a disproportionate cut. OPM supervisory-status codes for supervisors, managers and management officials fell from 321,630 to 290,471, a decline of 9.7%. Because the overall workforce fell 12.4%, those categories rose from 13.9% to 14.3% of covered employment.
This is not evidence that management was protected by design. It is evidence against the simpler claim that the restructuring mainly removed supervisory layers while sparing frontline and technical staff.
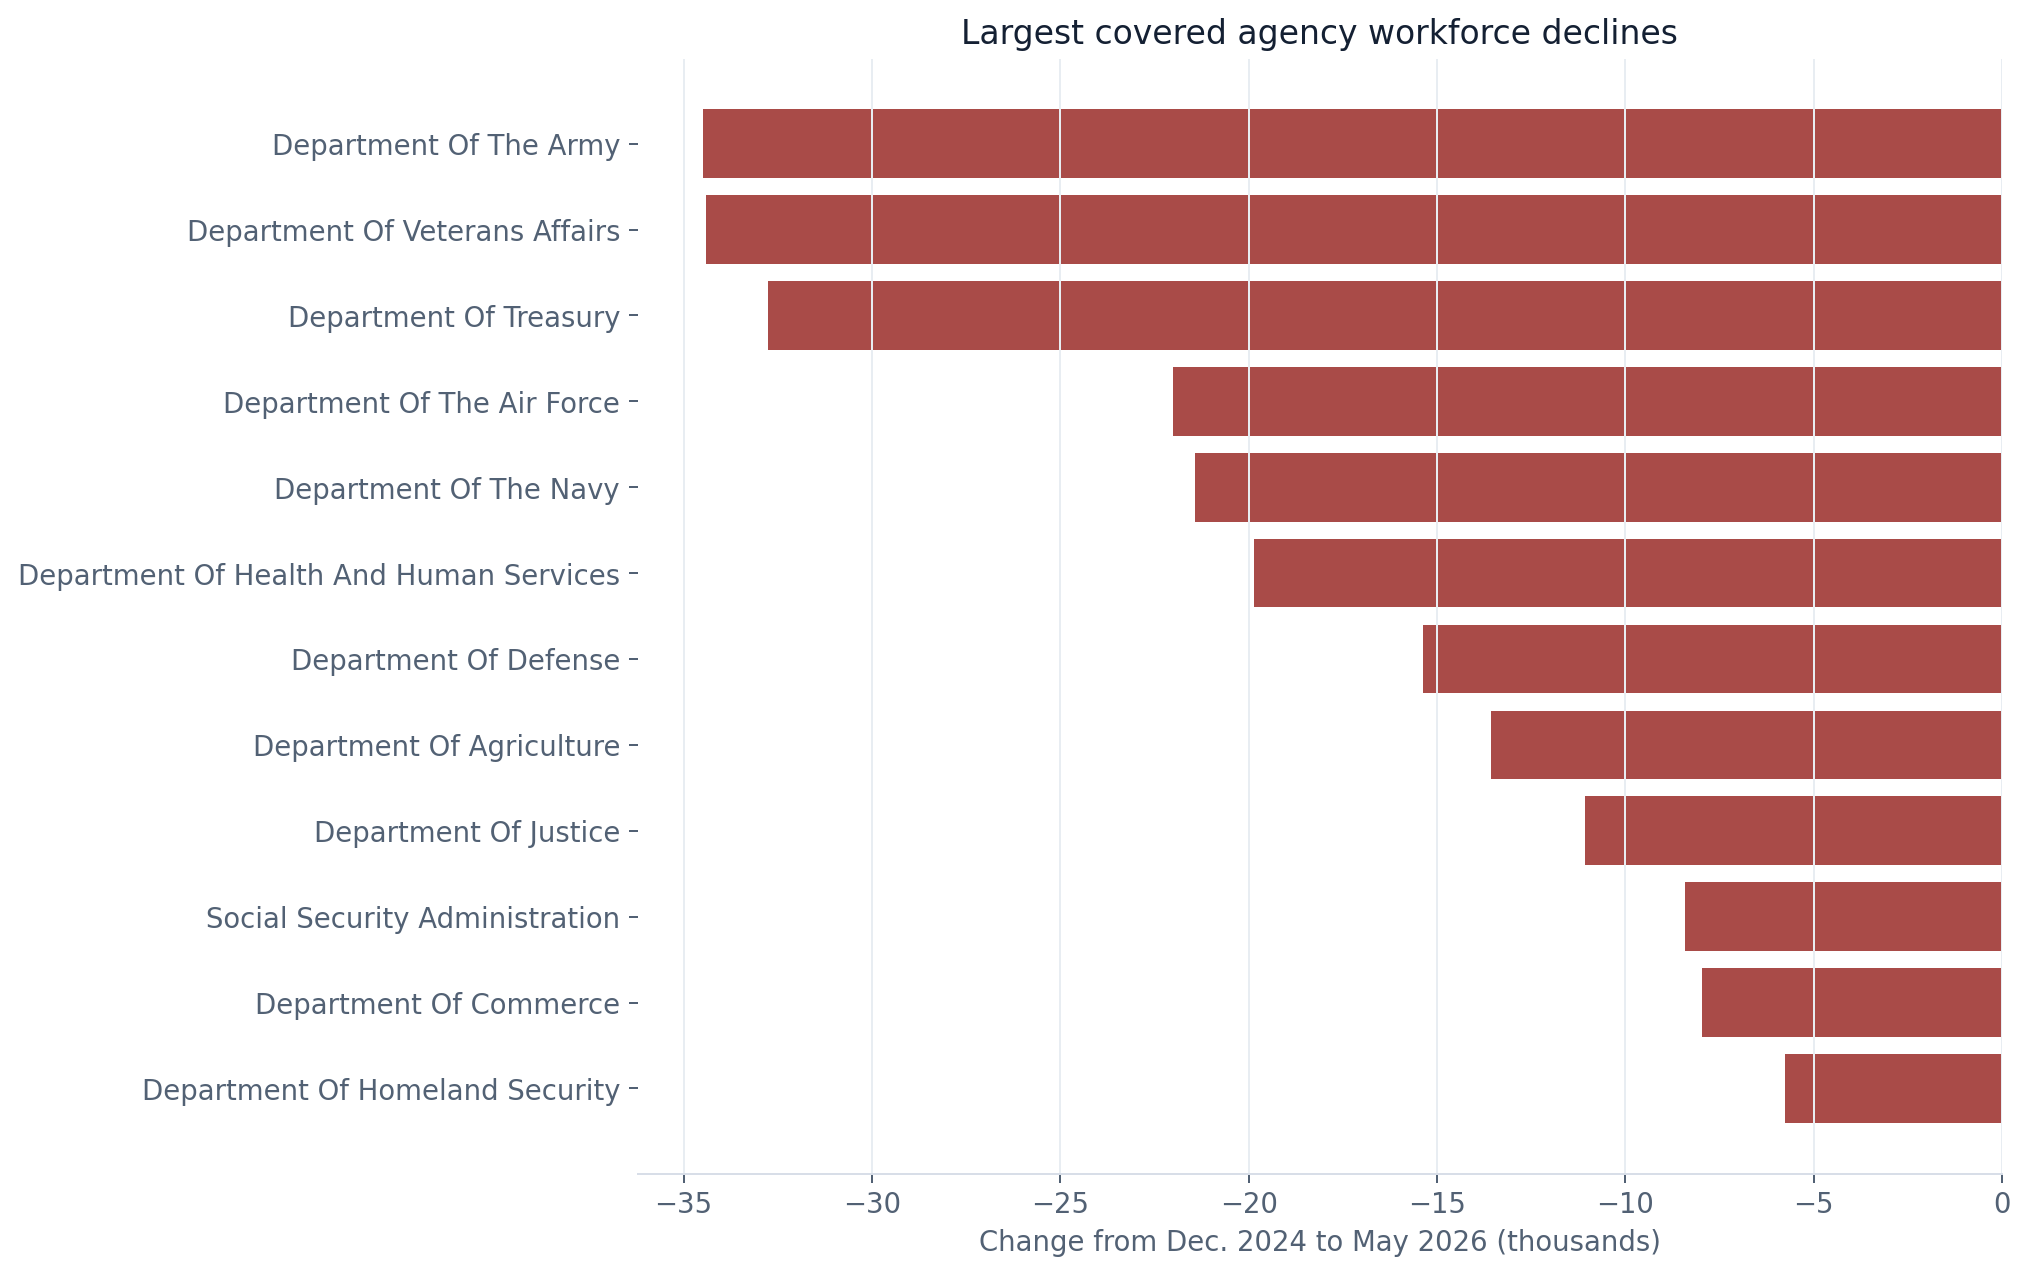
Which departments lost the most workers?
Army and Veterans Affairs each lost more than 34,000 covered workers. Treasury lost 32,761, Air Force 22,011, Navy 21,413 and HHS 19,849. Agriculture, Justice, Social Security, Commerce, Homeland Security and Interior also registered substantial declines.
Some smaller organizations changed more dramatically in percentage terms. USAID's covered count fell by 4,659, or 95.2%. GSA fell by 5,068. EPA fell by 4,433. These numbers do not by themselves establish that a statutory agency or function was abolished. A unit can lose staff while functions remain, move, contract out or operate at lower capacity.
The breadth of the decline matters for the efficiency claim. Cutting an administrative analyst, nurse, engineer, inspector and customer-service representative can all lower payroll. Their effects on public service are different. A governmentwide count cannot reveal whether an agency removed redundant work or merely distributed the same workload among fewer people.
Why did payroll fall less than headcount?
The average annualized adjusted basic pay visible in OPM records rose from $113,486 in December 2024 to $117,338 in May 2026, a nominal increase of 3.4%. Over the same period, headcount fell 12.4%.
Multiplying total covered headcount by the weighted mean produces an estimated annualized basic-pay roll of $262.41 billion before the contraction and $237.73 billion at the latest comparable point. The estimated decline is $24.69 billion, or 9.4%.
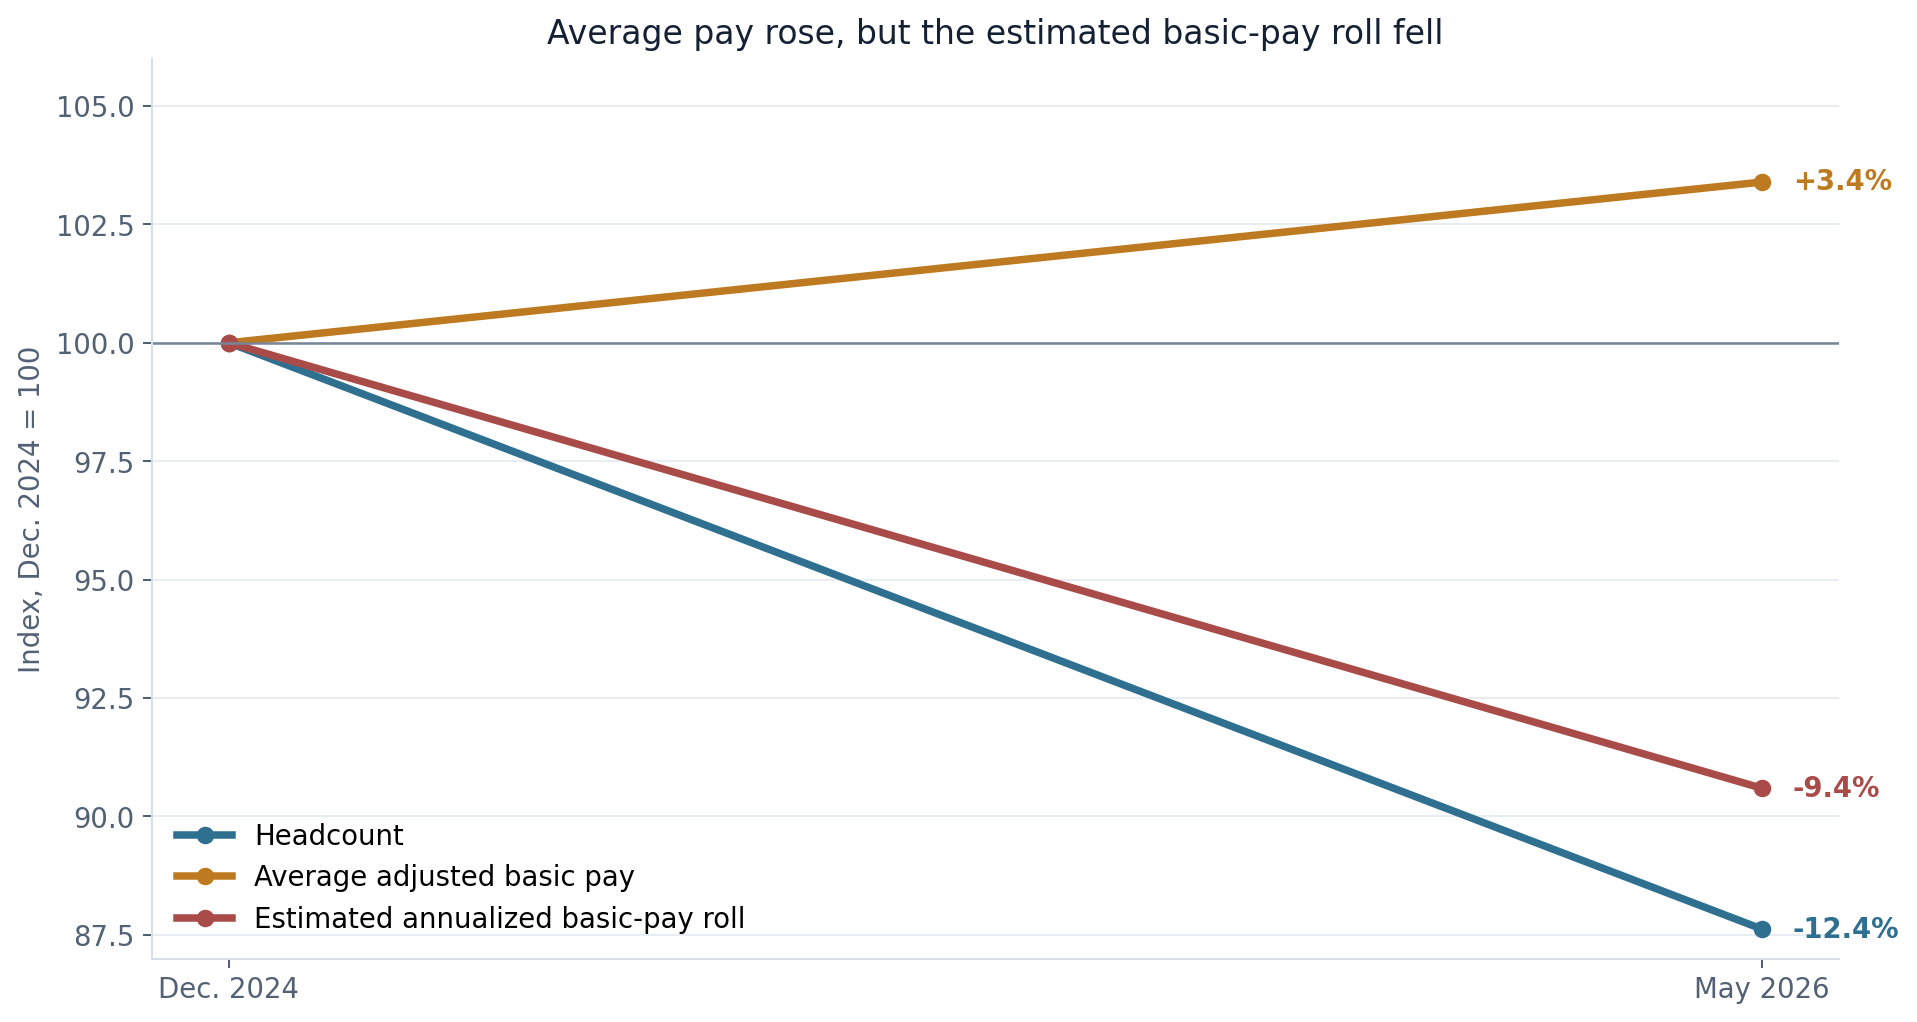
The divergence is not paradoxical once composition is considered. Governmentwide pay adjustments raised schedules in 2025 and 2026. Lower-paid and entry-level workers left. The remaining workforce mix changed. Locality and special rates also affect adjusted basic pay.
The estimate should not be called $24.7 billion in realized savings. Public salary was visible for 54.0% of covered headcount in December 2024 and 52.4% in May 2026. The calculation assumes those weighted averages represent records with redacted pay. It excludes employer benefits, overtime and other compensation, and it does not subtract deferred-resignation, severance, litigation, transition or rebuilding costs.
The SEC's FY2025 financial report shows why implementation belongs in the accounting. It reported $37.1 million in cost for 170 deferred-resignation participants and $23.9 million for 472 voluntary early-retirement or separation-incentive participants. That is one agency, not a basis for a governmentwide extrapolation. It is enough to show that gross payroll reduction and net savings are different measures.
How much of the $215 billion claim is publicly itemized?
The official DOGE savings page says estimated savings reached $215 billion as of January 1, 2026. It describes a broad total spanning asset sales, contract and lease actions, fraud and improper-payment deletion, grants, interest, program changes, regulation and workforce reductions.
FederalHiringData downloaded every row in the current public API. The contract rows sum to $61.02 billion in reported savings, grants to $49.21 billion and leases to $53.54 million. Together they total $110.28 billion, or 51.3% of the headline claim.
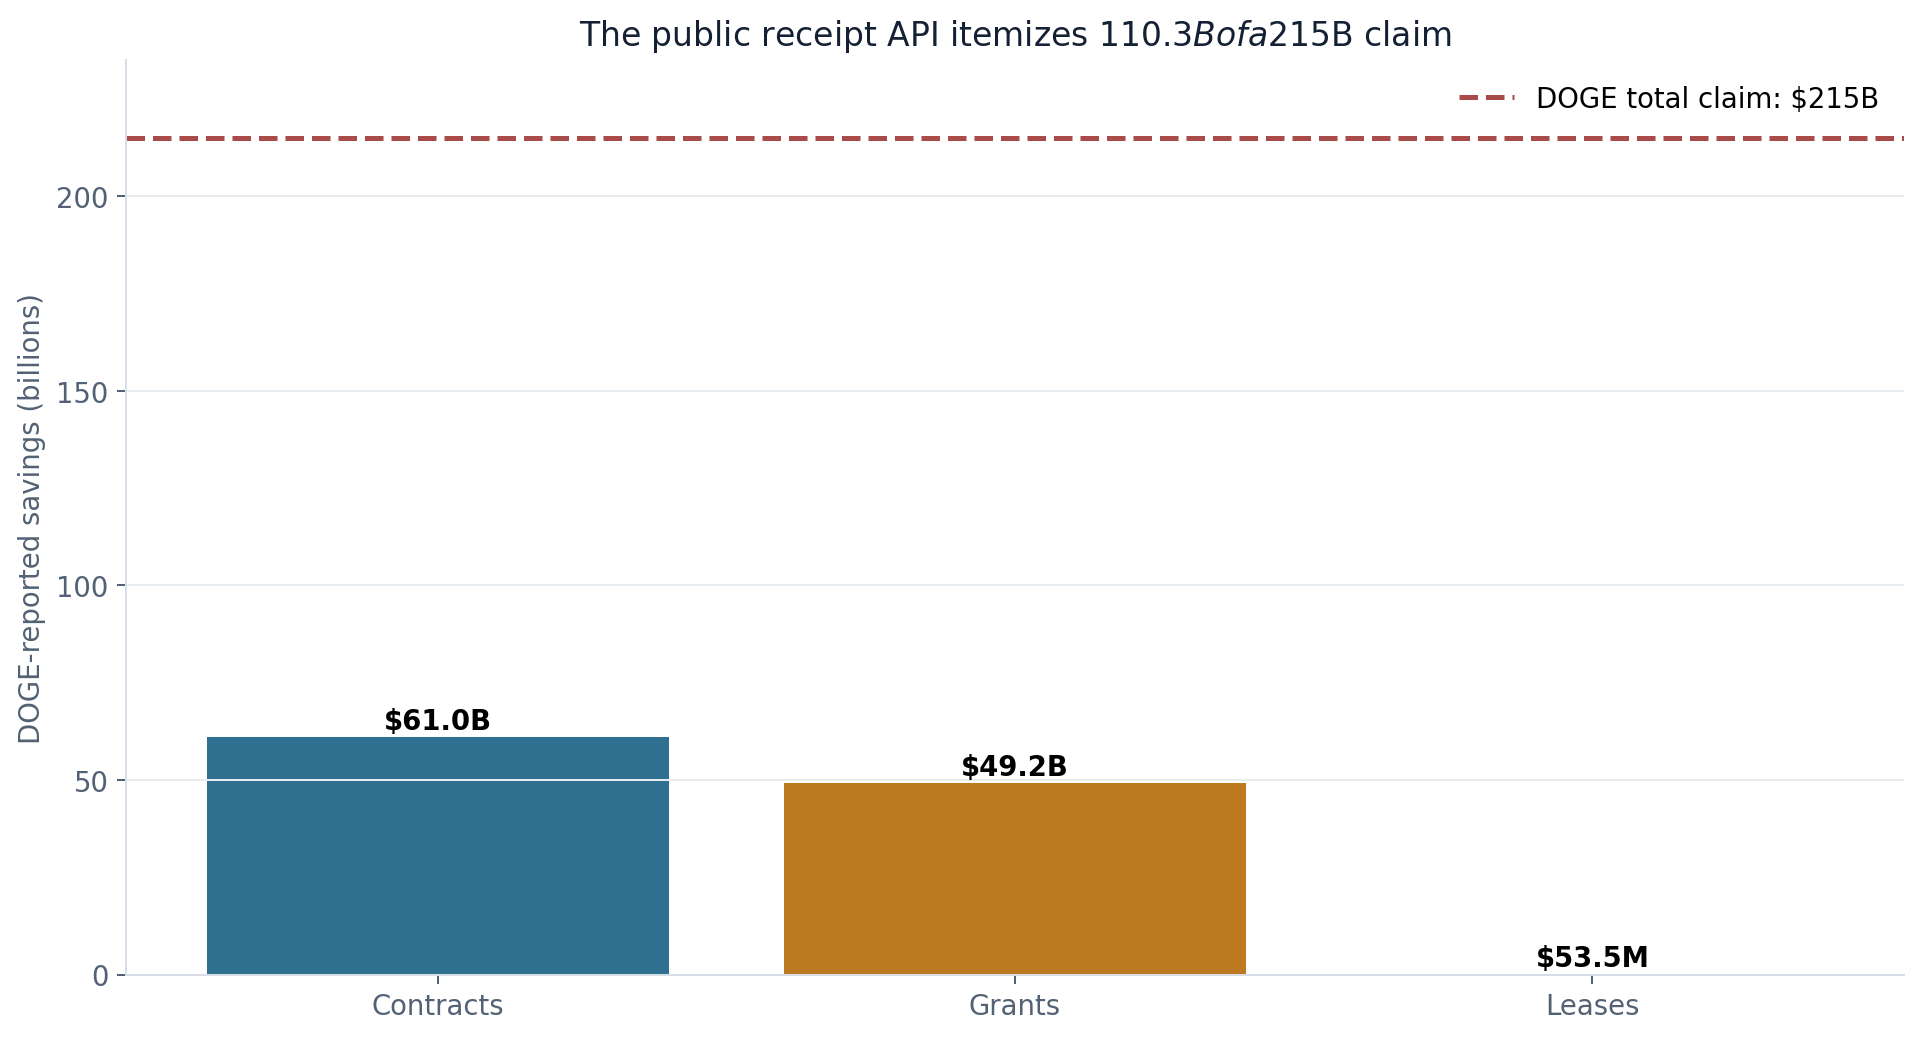
| Receipt category | Rows | API savings sum | API total-value sum | Important warning |
|---|---|---|---|---|
| Contracts | 13,440 | $61.02B | $156.50B | 5,812 rows report zero or negative savings |
| Grants | 15,887 | $49.21B | $118.60B | 2,799 rows report zero or negative savings |
| Leases | 264 | $53.54M | $112.94M | 142 rows have savings above listed total value |
| Itemized total | 29,591 | $110.28B | — | Not the same as realized net savings |
The lease line exposes an internal inconsistency. The public page says 264 lease terminations total about $113 million in savings. But $112.94 million is the API's total-value sum; its savings fields add to $53.54 million. That is not a rounding difference.
GAO's August 2026 audit adds a separate test. It found that a majority of contract savings did not use DOGE's stated method and that DOGE had insufficient methodological support for 96% of grant savings. GAO examined a Defense Health Agency IT contract listed at $1.7 billion in savings and found no termination, scope reduction, value reduction or funding reduction supporting that figure.
For leases, GAO found that 108 of the 264 actions, accounting for $15.3 million of the $53.5 million savings sum, were already underway before DOGE. DOGE may have accelerated, completed or publicized some of them; the public record did not support attributing all of that amount to the initiative.
None of this proves the unitemized portion is fictitious. Workforce reductions, interest, fraud prevention and programmatic changes can produce savings outside the receipt categories. It means the current public material is not sufficient to independently reproduce $215 billion. The site itself calls the receipts a subset, though its statement that they represent about 30% is stale relative to the API's current 51.3% sum.
Did fewer employees mean less contracting?
Official USAspending records show $740.95 billion in nominal federal contract obligations in FY2024 and $778.42 billion in FY2025. The $37.47 billion increase was 5.1%. Contract obligations have trended upward from a local-series low of $430.8 billion in FY2015.
That does not prove contractors replaced civil servants. Defense procurement, inflation, multiyear awards and program changes can move the aggregate independently of personnel. Proving substitution would require matching contract descriptions and timing to functions lost at specific agencies. The available governmentwide figures support a narrower conclusion: the civil service shrank, but one major measure of purchased work did not.
Recruiting moved in the opposite direction. FederalHiringData's USAJOBS archive counted 366,628 announcements opened in 2024 and 146,684 in 2025, a 60% decline. Announcements with a reported low grade from GS 1 through 7 fell from 120,026 to 56,604. Administration, IT, HR, engineering, contracting, natural-resources and physical-science series all recorded large posting declines.
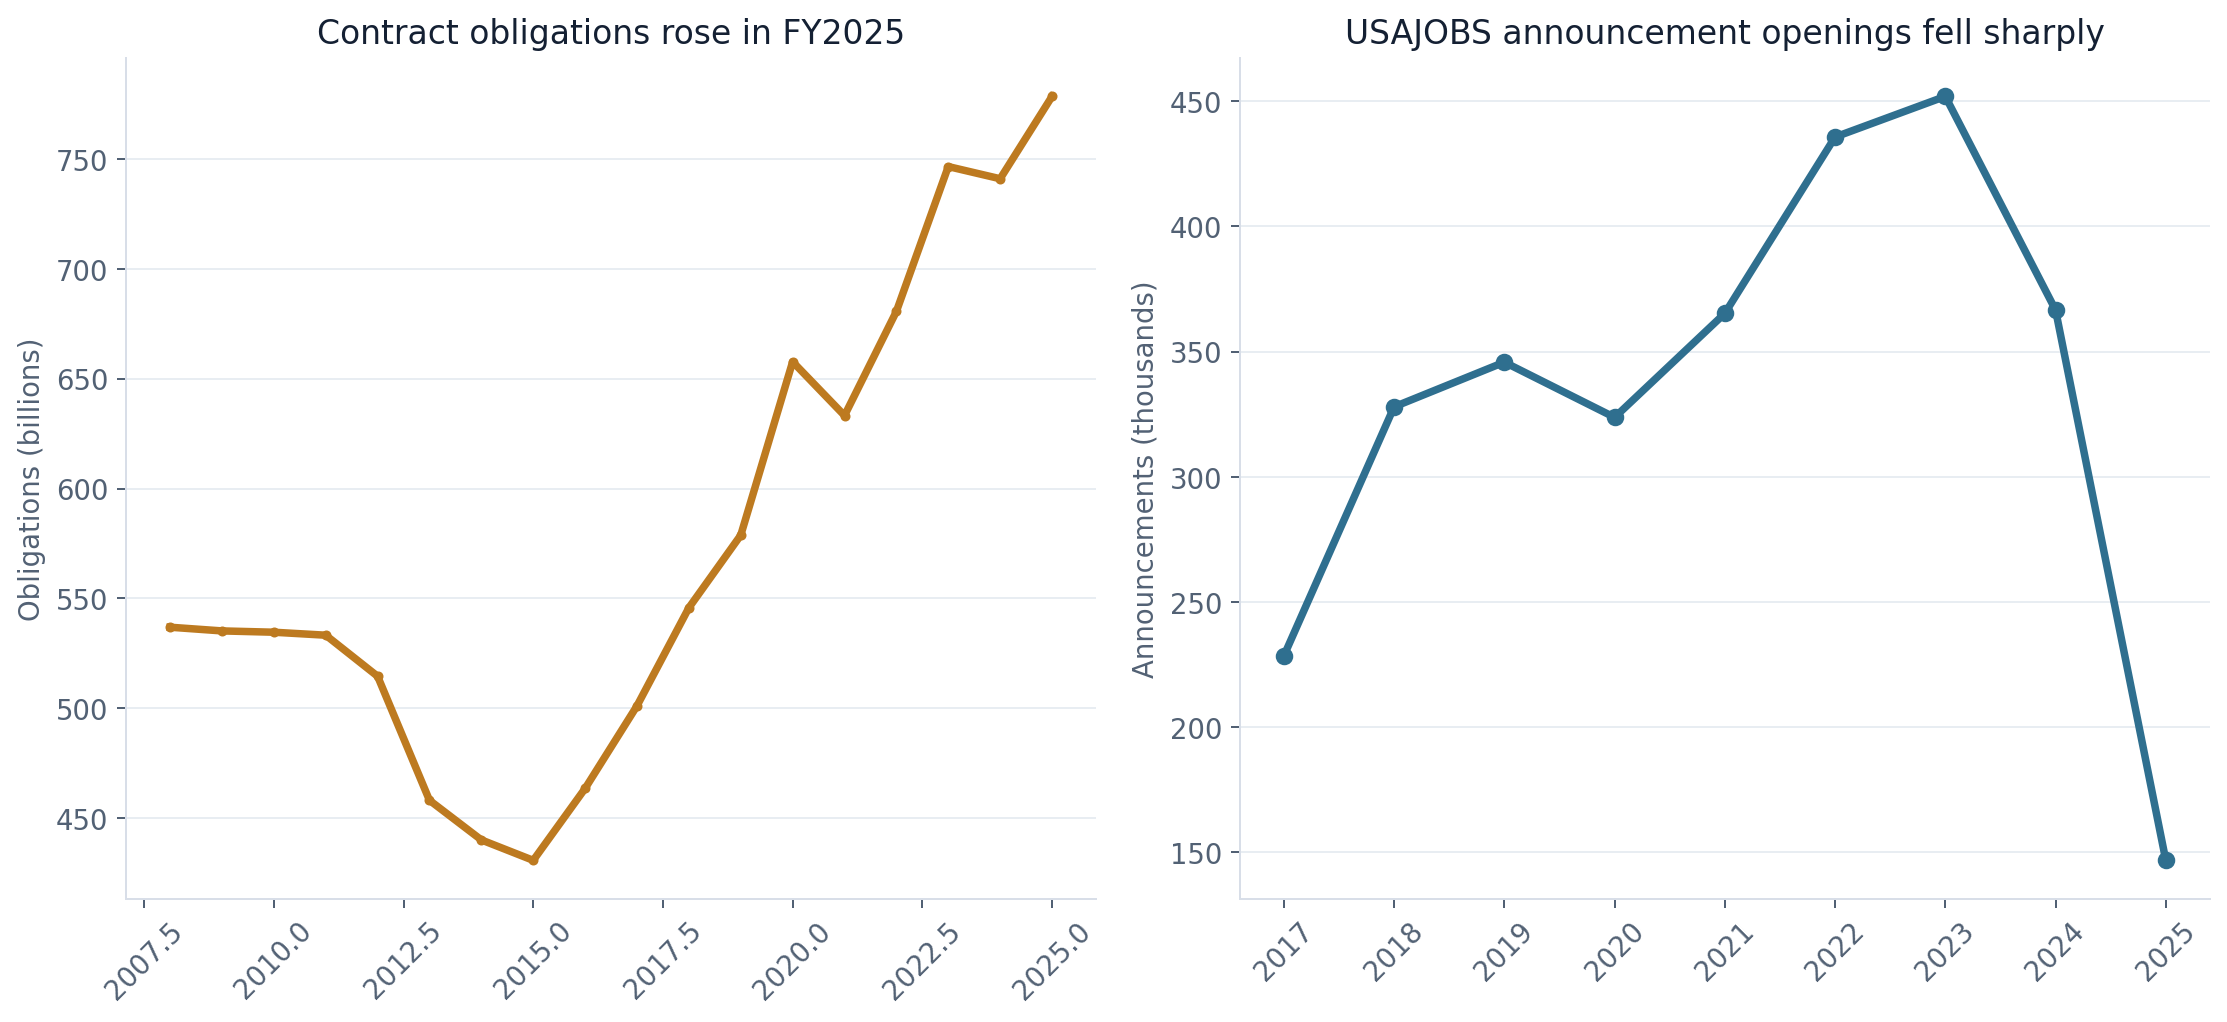
An announcement can cover one vacancy, many vacancies or an anticipated hiring need. It is not a hire. The archive begins in March 2017, so no pre-2017 recruiting history is invented. Still, the combined signal is clear: replacement through federal hiring slowed sharply at the same time contract obligations rose.
Did the federal lease footprint shrink?
The latest comparable Federal Real Property Profile summary predates DOGE. It reports 18,850 leased buildings and 278.9 million leased square feet across the combined civilian and Defense inventory in FY2024. Those values were slightly higher than in FY2022 and FY2023.
GSA publishes newer files for the properties it owns or leases, but GSA's portfolio is not the entire federal inventory. Splicing an August 2026 GSA count into the governmentwide FRPP series would create a false decline.
The correct answer to “How much did the federal lease footprint shrink?” is therefore unknown on a comparable governmentwide basis. The DOGE receipts identify actions, but they do not consistently provide remaining rent obligation, termination charges, moving costs, replacement space or whether cancellation was already planned. A lease's maximum face value is not the same as avoidable cash cost.
Did less rulemaking mean less regulatory burden?
Federal Register API results show 2,441 final-rule documents published in 2025, down from 3,248 in 2024 and the lowest full-year count from 2000 through 2025. That is a historically unusual decline in one measure of rulemaking output.
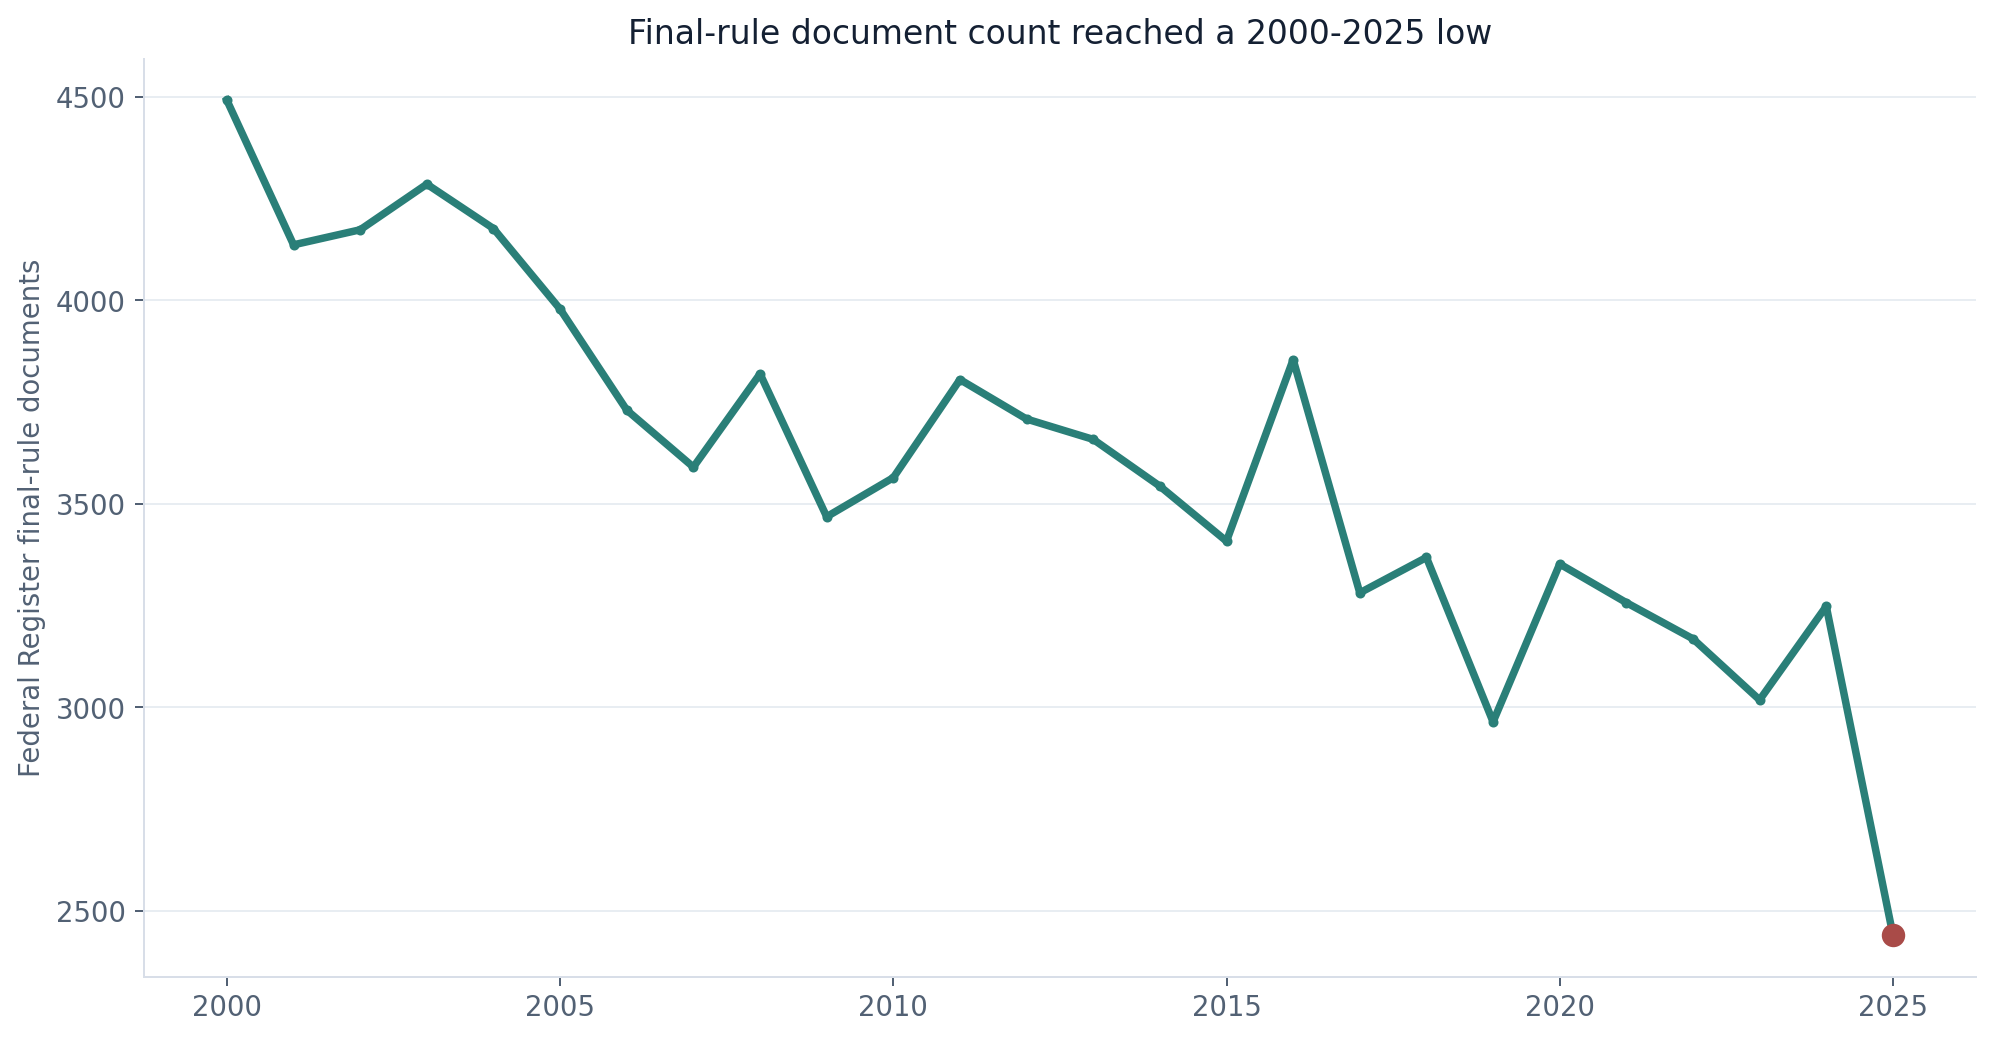
It is not proof that regulatory burden fell by the same percentage. One document can be narrow or consequential; repeal can require a rule; enforcement and permitting happen outside document counts. DOGE's regulations page claims $30.1 billion in savings and 1.9 million words deleted, but says some changes are still proposed, regulatory word deletion depends on final rulemaking and some savings figures are internal agency calculations that were not necessarily used in rulemaking.
The evidence supports “fewer final-rule documents,” not “better regulation” or “weaker protection.” Those judgments require program outcomes such as inspections, processing times, enforcement cases and compliance costs that are not available in one comparable governmentwide series.
Which government organizations actually changed?
Two cases suggested for this investigation show why legal status matters.
HHS announced a restructuring plan on April 2, 2025. It proposed reducing staffing from 82,000 to 62,000, consolidating 28 divisions into 15, reducing 10 regional offices to five and centralizing HR, IT, procurement, external affairs and policy. The plan described a CDC reduction of about 2,400 positions, or a net 1,400 after a proposed transfer of approximately 1,000 staff from the Administration for Strategic Preparedness and Response.
OPM data show HHS covered employment down 19,849 from December 2024 through May 2026. The CDC subelement fell from 12,788 to 9,218, a loss of 3,570, or 27.9%. Those are observed workforce counts, not a one-for-one audit of the plan. The announced boundary, transfers and OPM reporting boundary differ. They show implementation at scale without proving that every planned organization reached its final form or that response capacity improved or worsened.
The Interior example is newer and more legally definite. On July 10, 2026, Secretarial Order 3451 established the Marine Minerals Administration, the correct meaning of MMA in this context. It reunifies the Bureau of Ocean Energy Management and the Bureau of Safety and Environmental Enforcement, combining planning, permitting, inspection and enforcement responsibilities that were separated after the Deepwater Horizon disaster.
The order is effective, but Interior describes the transition as phased. It directs a final structure within nine months and keeps existing rules in force while authority transfers. This is therefore a legally established consolidation still being operationalized, not merely a proposal and not yet a completed operating-state comparison.
Before the merger, BSEE covered employment fell from 878 to 535 and BOEM from 626 to 457. Together, they lost 512 of 1,504 employees, or 34%. That makes staffing, inspections and enforcement useful tests of the new administration. It does not justify predicting an offshore safety outcome.
| Organization | Verified change | Current classification |
|---|---|---|
| HHS | Large staff reduction and announced consolidation | Partly implemented; final plan outcomes not all independently verified |
| CDC | Covered headcount down 3,570 | Workforce change verified; operational effects not established |
| Marine Minerals Administration | BOEM and BSEE reunified by Secretarial Order 3451 | Legally established; transition underway |
| OPM | 10 offices eliminated, according to GAO | Implemented; skills-gap risk documented |
| USAID | Covered headcount down 95.2% | Workforce collapse verified; not labeled statutory abolition here |
This table does not produce a satisfying count of “agencies eliminated,” because that count would be misleading. A renamed bureau can retain its people and functions. A consolidated office can continue the same work. An executive action can reduce staffing without repealing a statutory mission. Actual function elimination must be established organization by organization.
Did a smaller government become more efficient?
DOGE and the administration sought a smaller workforce, less real estate, fewer contracts and grants, lower regulatory cost and more efficient technology. The first objective is measurable: the covered workforce fell 12.4%, hiring was constrained and estimated annualized basic pay declined.
The public record also supports specific contract, grant, lease and regulatory actions. It does not yet combine them into a verified governmentwide net. The $215 billion headline mixes recurring and one-time categories, internal estimates and public receipts. Implementation costs are fragmented. Contract obligations rose. Comparable post-DOGE real-estate totals are unavailable. Service effects need time and agency-specific output data.
The lasting change may be compositional as much as numerical: fewer junior workers, millions of years of departing experience, a slightly higher formal management share, a smaller technical and administrative workforce, and more money obligated through contracts. Those conditions could produce efficiency if agencies eliminate work and modernize successfully. They could produce backlogs, contractor dependence and rebuilding costs if missions remain unchanged.
The evidence does not force one governmentwide answer. It supports a stricter one: DOGE-era restructuring made the federal workforce much smaller. Whether it made the government comparably cheaper and more capable cannot yet be demonstrated from the available accounts.
Readers can explore current federal jobs, the site's broader workforce statistics, agency records and additional FederalHiringData investigations.
Methodology and limitations
Definitions and timing. The central population is covered executive-branch civilian employment in OPM Federal Workforce Data, not uniformed military personnel and not necessarily every federal entity. December 2024 is the pre-restructuring benchmark. May 2026 is the latest comparable month. June 2026 is excluded because OPM's release omits roughly 83,000 Department of War component records. “DOGE period” describes timing; it does not assign every change to DOGE.
Headcount and flows. Point-in-time headcount comes from OPM monthly employment files. Accessions and separations come from monthly personnel-action files. They do not reconcile perfectly because a stock and cumulative flows have different timing, coverage and revisions. Separation categories are not added where they overlap. Deferred resignation is treated as a flag across personnel-action categories.
Experience. Total years associated with departures equal each separation row's public count multiplied by its reported length-of-service value for January 2025 through May 2026. The result is not a market valuation, proof of knowledge loss or estimate of departures caused by DOGE.
Pay. The estimated annualized basic-pay roll equals covered headcount multiplied by weighted mean annualized adjusted basic pay. Salary visibility was 54.0% in December 2024 and 52.4% in May 2026. The estimate is not audited expenditure, benefit cost, total compensation or net savings. No median is reported because redaction makes a simple public-record median unreliable.
Historical comparison. The long series uses OPM's Executive Branch Civilian Employment Since 1940 table. Recent monthly Federal Workforce Data differ in cadence and some boundaries, so the article compares scale and speed without asserting an exact all-time rank across the series break.
USAJOBS. FederalHiringData's canonical archive begins in March 2017. An announcement is not a vacancy or hire. 2026 is partial and excluded from full-year comparisons.
Contracts and savings. USAspending contract figures are nominal obligations, not ceilings or all outlays. DOGE receipt totals are sums of current official API fields. They remain attributed administrative estimates unless independent records establish realization. No contractor-substitution claim is made.
Real estate and regulation. FRPP supplies governmentwide comparable real-estate totals only through FY2024. Newer GSA portfolio data are not substituted. Federal Register document counts do not measure regulatory burden, enforcement or benefit.
Reorganization and service effects. HHS and Interior status comes from their official plans and orders. Proposed, established, transitional and completed changes are kept separate. No cross-agency service-delivery effect is asserted without operational measures.
The complete calculation files, source inventory, SQL, quality checks and chart data are preserved in the FederalHiringData local research pack. Research and writing OpenAI API calls: 0.
Hero image: An unoccupied workspace in the Chet Holifield Federal Building. U.S. General Services Administration photograph, a U.S. federal government work.
Keep reading
Related federal hiring research
Article data window: FY2019-FY2025
Contract Spending and Federal Headcount Often Moved Independently
Across a bounded 28-agency sample, contract-obligation growth and covered headcount growth had only a 0.169 correlation; five agencies increased obligations while headcount fell.
Article data window: Jan. 1-14, 2026
Federal Healthcare Hiring Led Early January 2026 Job Announcements
Veterans Health Administration, nurse roles, medical officers, and other clinical and support occupations drove the strongest healthcare signal in the early January archive.
Article data window: Jan. 1-14, 2026
Federal Hiring Trends: Jan. 1-7 vs Jan. 8-14, 2026
Veterans Health Administration stayed dominant, nurse and medical roles strengthened, and remote-work signals remained too sparse for a public trend claim.
Federal Hiring Data Weekly
Subscribe to Federal Hiring Data Weekly.
Subscribe to Federal Hiring Data Weekly. Confirm your email after signing up to receive federal hiring trends, salary data, agency movements, and original research.