March 31, 2026
How the Federal Job Announcement Mix Shifted in Early 2026
Q1 announcement volume was 6.7% lower in 2026 than in 2025, but nurse and medical officer postings rose while several administrative and IT series declined.
By Evan Mercer

Federal job announcement volume was lower in the first quarter of 2026 than in the same three months of 2025, but the change was not uniform across occupations.
52,951 announcements closed in January-March 2026, down 3,798, or 6.7%, from 56,749 in Q1 2025. Nursing and medical officer announcements increased. Several large administrative, management-analysis and information technology series decreased.
That makes the period better understood as a shift in the advertised occupation mix than as one universal decline. The comparison also highlights a boundary: postings reveal where agencies advertised work, not how many employees they ultimately hired.
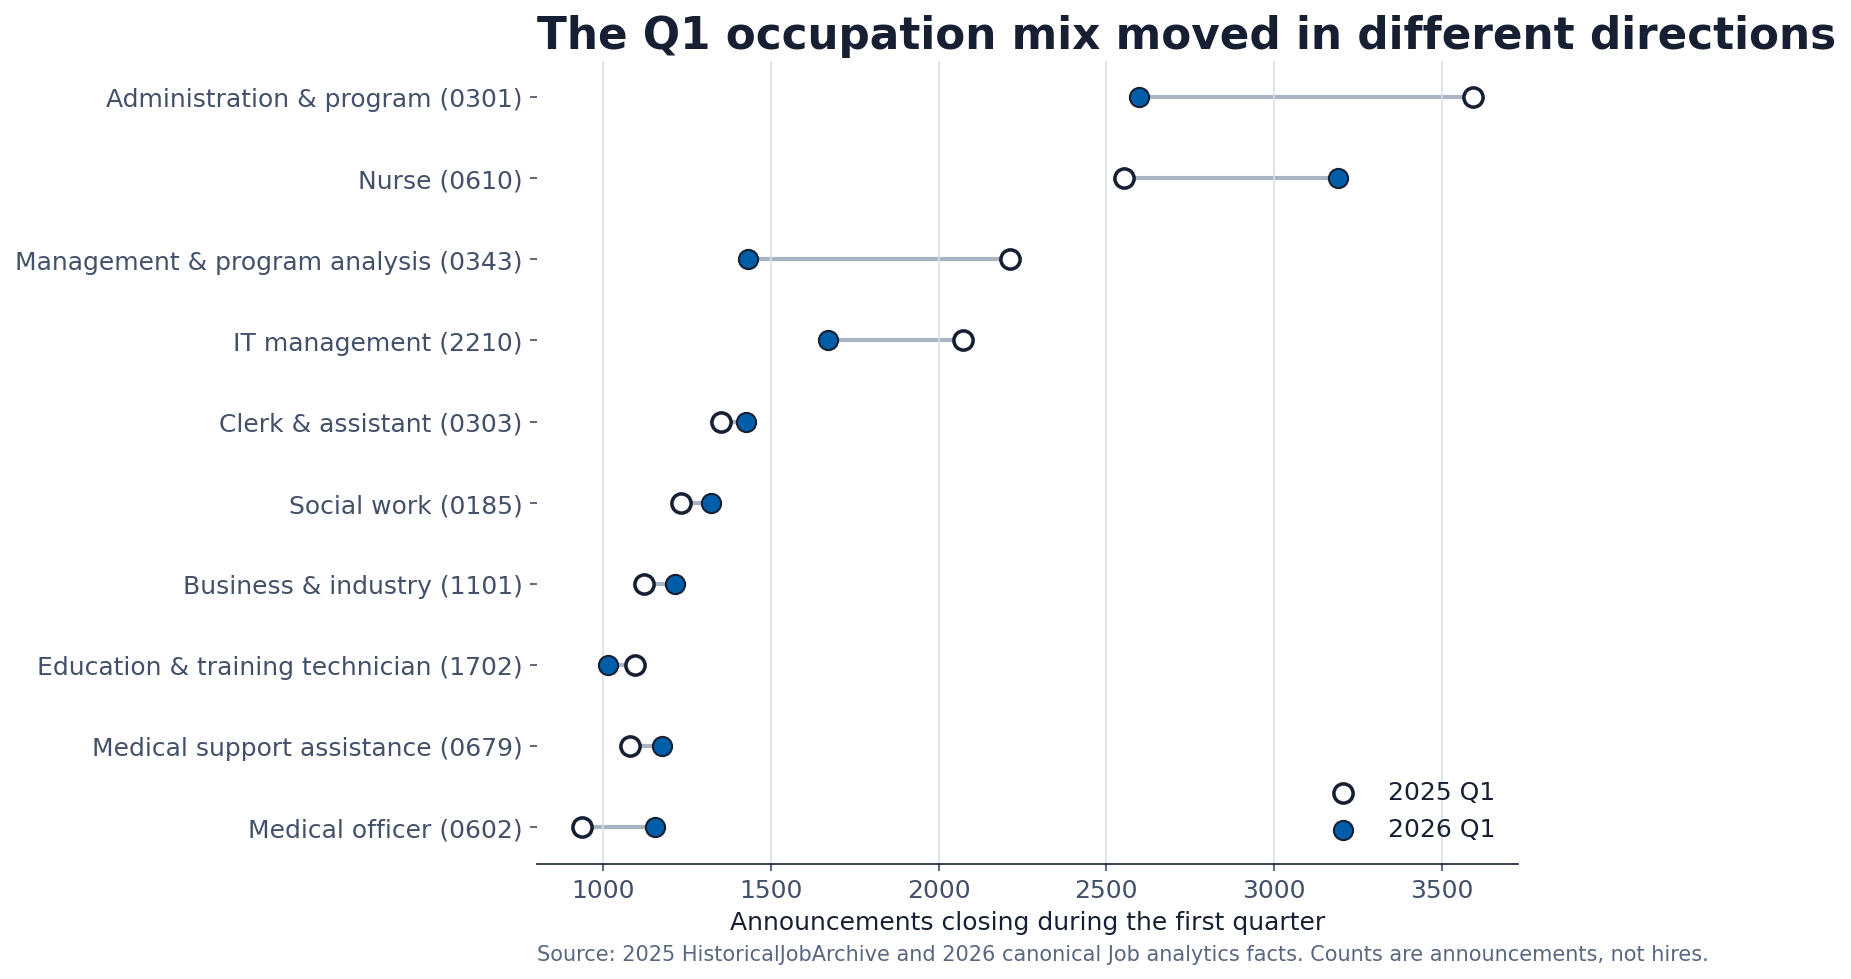
Nursing moved to the top of the Q1 ranking
Nurse series 0610 recorded 3,192 announcements in Q1 2026, up from 2,554 one year earlier. The increase of 638 was 25.0%, enough to move nursing ahead of Miscellaneous Administration and Program as the largest series in the 2026 quarter.
Medical Officer series 0602 rose from 936 to 1,154, a 23.3% increase. Social Work rose 7.4%, Medical Support Assistance 8.7% and Miscellaneous Clerk and Assistant 5.6%.
| Occupational series | Q1 2025 | Q1 2026 | Change | Percent change |
|---|---|---|---|---|
| Nurse (0610) | 2,554 | 3,192 | +638 | +25.0% |
| Medical Officer (0602) | 936 | 1,154 | +218 | +23.3% |
| Medical Support Assistance (0679) | 1,081 | 1,175 | +94 | +8.7% |
| General Business and Industry (1101) | 1,121 | 1,214 | +93 | +8.3% |
| Social Work (0185) | 1,231 | 1,322 | +91 | +7.4% |
| Miscellaneous Clerk and Assistant (0303) | 1,351 | 1,426 | +75 | +5.6% |
The increases do not necessarily represent equivalent growth in distinct vacancies. Healthcare agencies often use announcements that can cover multiple openings, recurring recruitment or several locations. They do show that clinical and patient-support series occupied more of the visible announcement market in early 2026.
Several broad professional series declined
Miscellaneous Administration and Program series 0301 fell from 3,595 to 2,598, a decline of 997 or 27.7%. Management and Program Analysis series 0343 fell 35.2%, from 2,212 to 1,433. Information Technology Management series 2210 fell 19.5%, from 2,074 to 1,669.
| Occupational series | Q1 2025 | Q1 2026 | Change | Percent change |
|---|---|---|---|---|
| Management and Program Analysis (0343) | 2,212 | 1,433 | -779 | -35.2% |
| Miscellaneous Administration and Program (0301) | 3,595 | 2,598 | -997 | -27.7% |
| Information Technology Management (2210) | 2,074 | 1,669 | -405 | -19.5% |
| Education and Training Technician (1702) | 1,096 | 1,014 | -82 | -7.5% |
These are large and diverse series. A 0301 posting can describe many kinds of program work; 0343 spans management and program analysis across agencies; 2210 covers a wide range of IT specialties. The series totals are useful for detecting direction, but not for claiming that every specialty or grade moved together.
VHA's share became smaller even as healthcare series grew
Veterans Health Administration announcements fell from 11,918 in Q1 2025 to 7,712 in Q1 2026, a 35.3% decline. Its share of the total moved from 21.0% to 14.6%, down 6.4 percentage points.
That may seem inconsistent with the growth in nurse and medical officer series. It is not. Occupations can be posted by agencies outside VHA, and VHA can advertise many occupations beyond clinical roles. A series trend and an agency trend describe different dimensions of the market.
It also shows why one ranking should not stand in for the whole system. VHA remained a major source of announcements, but its reduced share created room for the occupation mix to move differently from its agency total.
What changed for applicants
Applicants in nursing, medicine, social work and medical support saw more announcements in these Q1 close-date cohorts than one year earlier. Applicants in broad administrative, program-analysis and IT series saw fewer. That does not establish whether competition per opening rose or fell because the archive does not contain a complete applicant count.
Nor does it mean every 2026 announcement was open to the public. Hiring paths can restrict an opportunity to agency employees, federal status candidates, veterans or other audiences. Job seekers should combine the series signal with the actual eligibility, grade, location and specialized-experience requirements in each live announcement.
A year-over-year quarter comparison is more stable than a one-week snapshot, but it is still a short window. Seasonal recruiting, recurring VHA announcements, agency operating plans and administrative deadlines can affect the result. More quarters are needed before calling any movement a durable multi-year trend.
Readers can use the current job search to see open announcements by series and location, and Statistics for current archive scope. The Q1 comparison here is historical and does not imply that a cited announcement remains open.
Why the total alone misses the story
A 6.7% decline in total announcements sounds modest compared with the series-level changes. That aggregate combines occupations moving in opposite directions. Nursing increased by one-quarter while management and program analysis declined by more than one-third.
Composition matters to both applicants and workforce researchers. A market with roughly similar total volume can still feel very different if advertised opportunities shift toward clinical work and away from administrative analysis. The series comparison is therefore not a footnote to the total; it is the main result.
Methodology and limitations
FederalHiringData compared distinct announcements with close dates from Jan. 1 through March 31 in 2025 and 2026. The 2025 cohort comes from HistoricalJobArchive and associated series rows. The 2026 cohort comes from canonical Job records joined to JobAnalyticsFact. Series codes provide the comparison key.
The two years come from different internal source tables because the historical archive and canonical job store cover different ingestion periods. Both originate in USAJOBS records, but source-system and normalization differences remain a limitation. A distinct-agency count for 2026 was rejected because unnormalized source-name variation made it unreliable; no agency-diversity claim is based on that field.
Announcement counts are not positions, applicants, referrals, selections or hires. Multi-vacancy and recurring announcements can affect occupation totals. The article is descriptive and comparative, not causal. It does not use workforce releases published after the March 31, 2026 historical cutoff. Source documentation: USAJOBS Developer and FederalHiringData's methodology. Photo: Wade Sisler, NASA, via Wikimedia Commons, public domain.
Keep reading
Related federal hiring research
Article data window: FY2019-FY2025
Contract Spending and Federal Headcount Often Moved Independently
Across a bounded 28-agency sample, contract-obligation growth and covered headcount growth had only a 0.169 correlation; five agencies increased obligations while headcount fell.
Article data window: Jan. 1-14, 2026
Federal Healthcare Hiring Led Early January 2026 Job Announcements
Veterans Health Administration, nurse roles, medical officers, and other clinical and support occupations drove the strongest healthcare signal in the early January archive.
Article data window: Jan. 1-14, 2026
Federal Hiring Trends: Jan. 1-7 vs Jan. 8-14, 2026
Veterans Health Administration stayed dominant, nurse and medical roles strengthened, and remote-work signals remained too sparse for a public trend claim.
Federal Hiring Data Weekly
Subscribe to Federal Hiring Data Weekly.
Subscribe to Federal Hiring Data Weekly. Confirm your email after signing up to receive federal hiring trends, salary data, agency movements, and original research.