August 19, 2026
Federal Pay Rose 14%. Prices Rose Nearly Twice as Fast.
Consumer prices rose 27.7% from January 2021 through July 2026 while the GS base schedule rose 14.4%. Locality pay narrowed, but did not erase, the loss in scheduled purchasing power.
By Evan Mercer
Published August 19, 2026Last edited August 19, 2026

Federal paychecks are larger than they were five years ago. The price tag attached to everyday life grew much faster.
From January 2021 through July 2026, the Consumer Price Index for All Urban Consumers rose 27.7%. Over the same span, annual General Schedule base adjustments after the January 2021 starting point compounded to 14.4%. For a hypothetical employee who stayed at the same GS grade and step and received only those government-wide base adjustments, the scheduled rate of pay lost 10.4% of its purchasing power.
Locality pay softened the loss, but did not eliminate it in five large and geographically varied pay areas examined for this article. Their same-grade, same-step salaries rose between 15.5% and 18.4%, leaving their real value about 7.3% to 9.5% below January 2021 after national inflation.
That is not the same as saying every federal employee became 10% worse off. Within-grade increases, promotions, career ladders, special salary rates and changes in locality can all lift an individual's pay beyond the annual adjustment. The public workforce data tells another part of the story: average reported adjusted basic pay rose almost exactly as fast as inflation between June 2021 and June 2026, while the GS workforce became more concentrated at higher grades.
Three measures therefore point in different directions. The pay schedule lost ground. The observed workforce average roughly held its real value. An individual employee's earnings could have followed either path, or neither.
How far did the GS base schedule fall behind?
The inflation comparison starts with index levels, not a sum of annual inflation rates. The unadjusted CPI-U was 261.582 in January 2021 and 333.918 in July 2026, according to the Bureau of Labor Statistics' latest CPI release. Dividing the latter by the former produces a cumulative price increase of 27.65%. BLS reported that prices were also 3.4% higher than a year earlier in July.
The pay side uses the annual General Schedule base increases published in official Office of Personnel Management salary tables. Because January 2021 is the starting level, that year's 1% increase is already embedded in the baseline. The subsequent increases were compounded rather than added.
| Effective year | GS base adjustment | Pay index, Jan. 2021 = 100 |
|---|---|---|
| 2021 baseline | 1.0% already in starting table | 100.0 |
| 2022 | 2.2% | 102.2 |
| 2023 | 4.1% | 106.4 |
| 2024 | 4.7% | 111.4 |
| 2025 | 1.7% | 113.3 |
| 2026 | 1.0% | 114.4 |
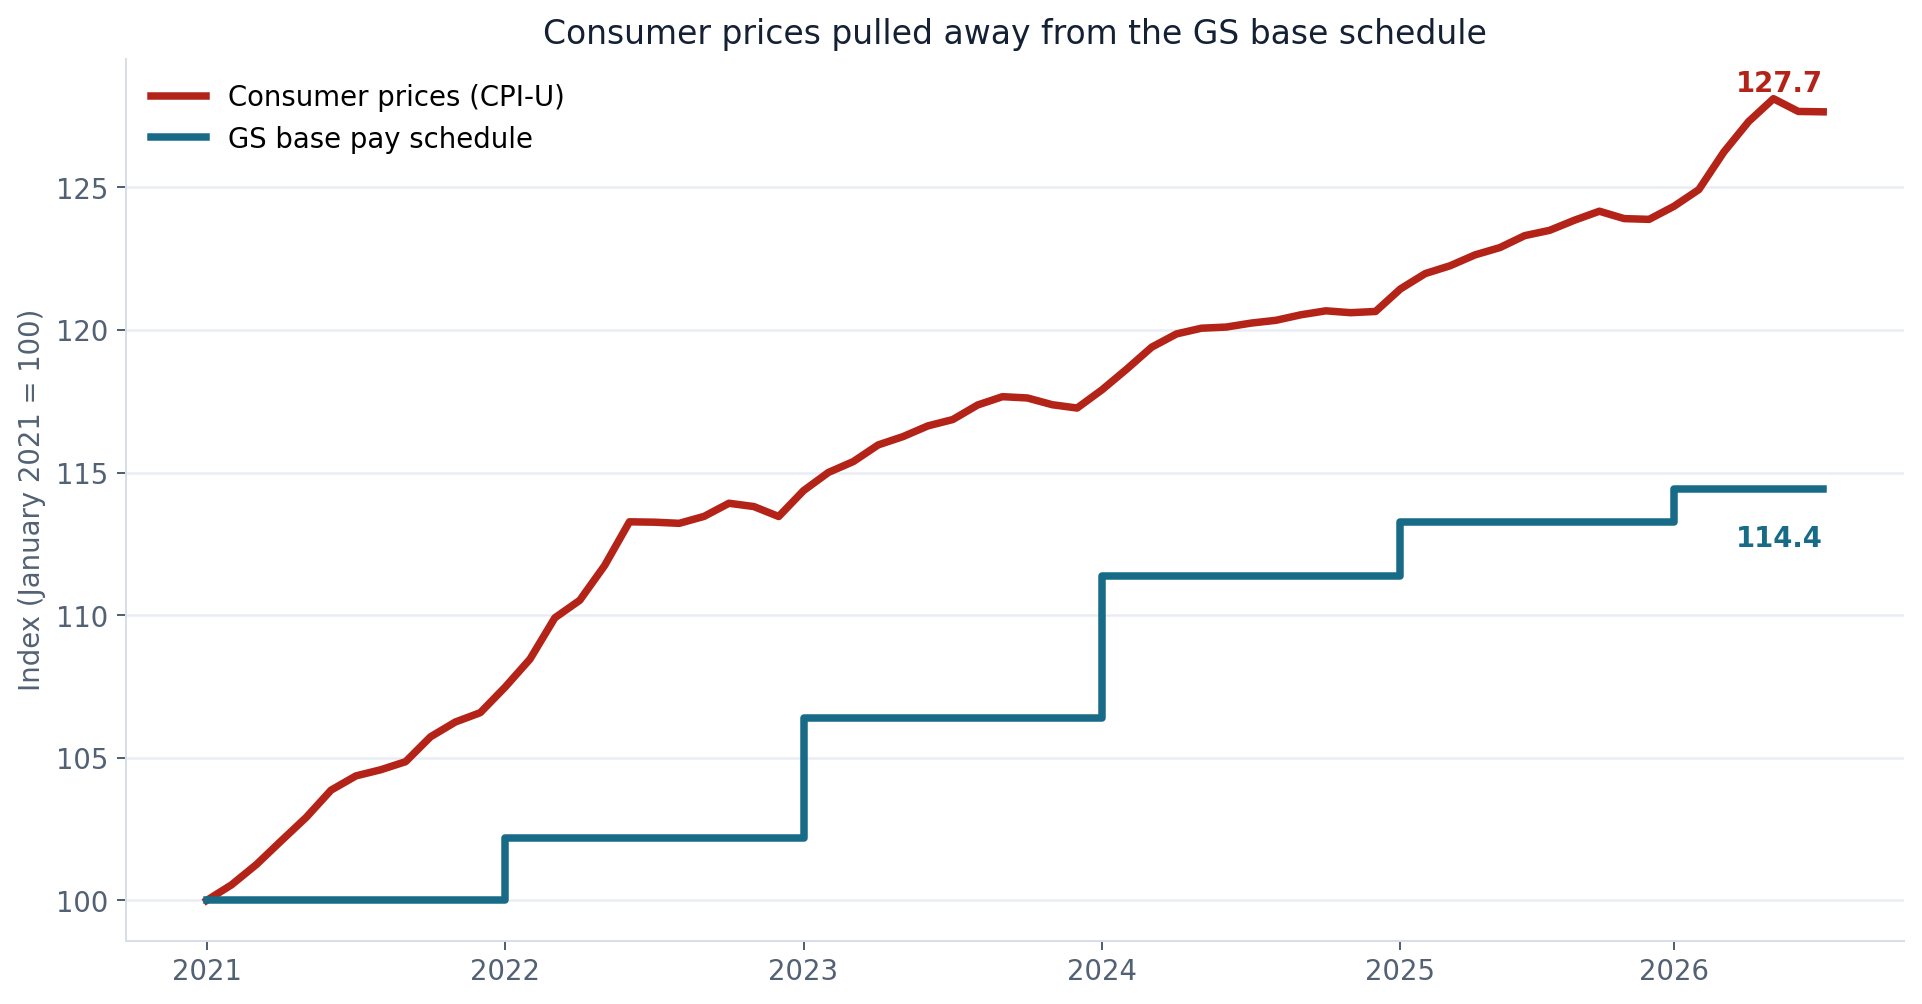
The gap is easier to understand as a basket. Goods and services costing $100 at the start of the comparison cost about $127.65 in July 2026. The GS base rate attached to the same grade and step grew to about $114.42. Dividing the pay index by the price index, rather than simply subtracting their percentage changes, leaves the scheduled base rate with 89.63% of its January 2021 purchasing power.
This is a measure of the rate table, not take-home pay. It does not include taxes, benefit-premium changes, overtime or any personnel action that moved an employee to another rate.
Did locality pay close the gap?
Not completely. Locality rates rose more than the base schedule in the sampled areas because changes in locality percentages compounded with the base increases. San Francisco had the largest nominal gain among the five, while Rest of U.S. had the smallest.
The table below shows a GS-12 step 5 salary as a readable example. The analysis also checked GS-5 step 1, GS-9 step 5 and GS-13 step 5. Within each locality, rounding aside, the percentage result was nearly identical across those uncapped grades and steps.
| Locality pay area | 2021 GS-12 step 5 | 2026 GS-12 step 5 | Nominal change | Real change after CPI-U |
|---|---|---|---|---|
| Rest of U.S. | $87,822 | $101,443 | +15.5% | -9.5% |
| Washington-Baltimore-Arlington | $98,827 | $116,071 | +17.4% | -8.0% |
| New York | $101,478 | $119,546 | +17.8% | -7.7% |
| San Francisco | $107,128 | $126,817 | +18.4% | -7.3% |
| Los Angeles | $100,289 | $118,264 | +17.9% | -7.6% |
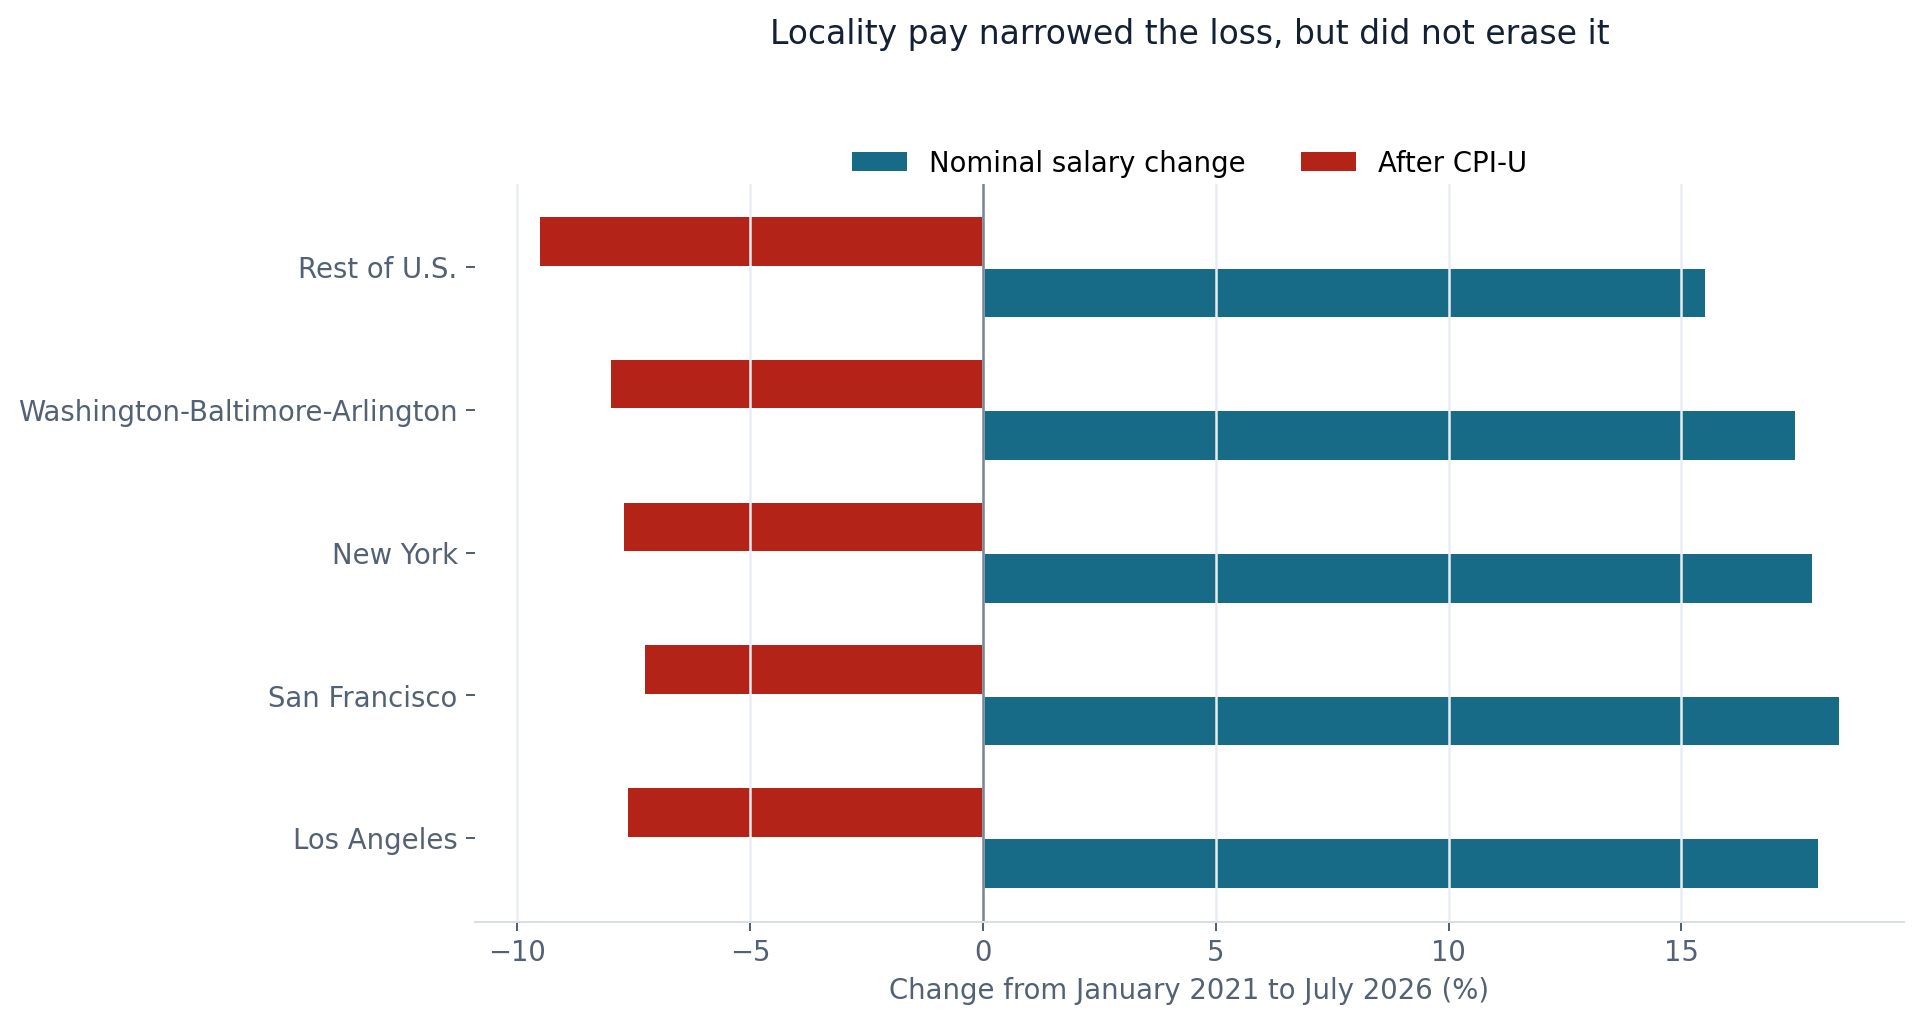
These are direct comparisons of the 2021 and 2026 OPM salary tables. They hold grade, step and locality constant, which is the cleanest way to isolate the schedule change.
They do not show whether San Francisco became more or less affordable than Washington. Locality pay is built around nonfederal salary comparisons, not a local cost-of-living formula. This analysis uses the same national CPI-U benchmark for all five areas so that the rate-table comparison is consistent. A worker's own housing, commuting and family costs can differ sharply from that national basket.
Why did the observed average salary appear to keep up?
OPM's public Federal Workforce Data offers a wider measure: annualized adjusted basic pay reported across covered civilian employment records. It includes basic pay plus applicable locality and certain special adjustments, but not total earnings such as overtime.
For a seasonally consistent comparison, the analysis matched June 2021 with June 2026. The weighted mean among records with a reported salary rose from $95,278 to $117,339, a nominal gain of 23.2%. CPI-U rose 22.9% between those two months. In June 2021 dollars, the 2026 average was about $95,465, just 0.2% above the earlier level.
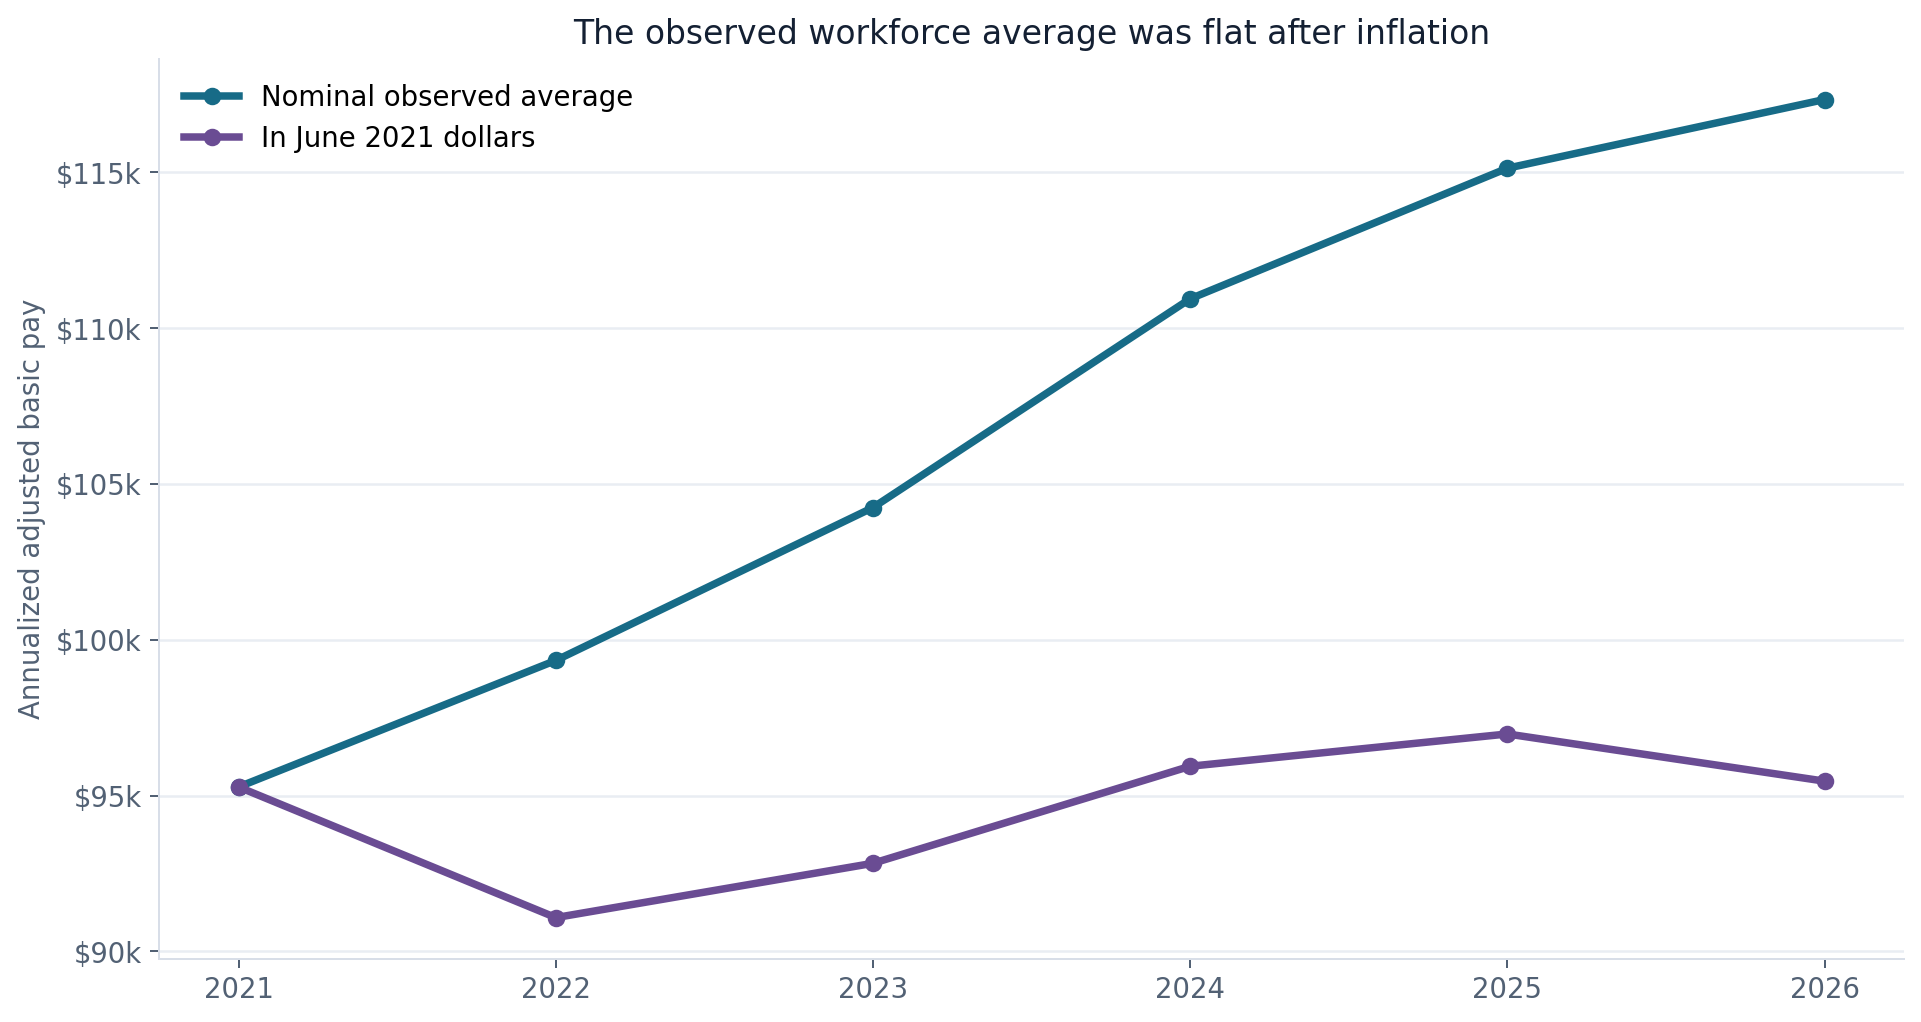
The real average fell to about $91,086 in 2022, recovered over the next three years and ended close to where it began. That recovery is meaningful at the workforce level. It is not evidence that the person earning $95,278 in 2021 necessarily reached $117,339 in 2026.
The people in the two snapshots are not identical. Employees entered and left government, changed jobs, advanced grades, moved between locations and received special rates. The covered employment count also declined from about 2.19 million to 1.95 million. When the composition of a workforce changes, its average can rise even if no continuing employee receives the average increase.
Salary visibility is another constraint. OPM notes that salary data is redacted for many employees under its release policy. A usable salary appeared for 52.7% of covered June 2021 employment and 54.4% in June 2026. Those similar coverage rates make the comparison useful, but they do not eliminate selection bias. A median was not reported because the public salary field is incomplete and a simple median of released records would imply more precision than the data supports.
Did the federal workforce shift toward higher grades?
Yes, within the GS population represented in the public files. GS-13 and above accounted for 30.3% of GS employment in June 2021 and 32.4% in June 2026. GS-12 rose from 20.1% to 21.5%. At the other end, GS-5 and below fell from 8.5% to 5.8%.
| GS grade band | Share in June 2021 | Share in June 2026 | Change |
|---|---|---|---|
| GS-5 and below | 8.5% | 5.8% | -2.7 points |
| GS-7 | 7.6% | 6.5% | -1.1 points |
| GS-9 | 9.1% | 8.4% | -0.7 points |
| GS-11 | 13.4% | 14.0% | +0.6 points |
| GS-12 | 20.1% | 21.5% | +1.4 points |
| GS-13 and above | 30.3% | 32.4% | +2.1 points |
| Other GS grades | 10.9% | 11.4% | +0.4 points |
That shift can lift the overall salary average because higher grades carry higher rates. It likely explains part of the difference between the 10.4% real loss in a fixed base-pay rate and the nearly flat real workforce average. The data does not establish why the mix changed. Retirements, hiring patterns, agency restructuring, occupational shifts and promotions may all contribute, and the figures alone cannot assign causality.
The same caution applies to occupations. A nurse, IT specialist and contracting officer do not share the same pay system, location mix or special-rate exposure. Combining those differences into a single occupational trend would make the article look more precise while making the answer less reliable.
Which household costs moved farthest ahead?
The broad CPI result can feel abstract because no household buys the index in exactly its published proportions. Several familiar expenses moved much more than the 27.7% all-items average.
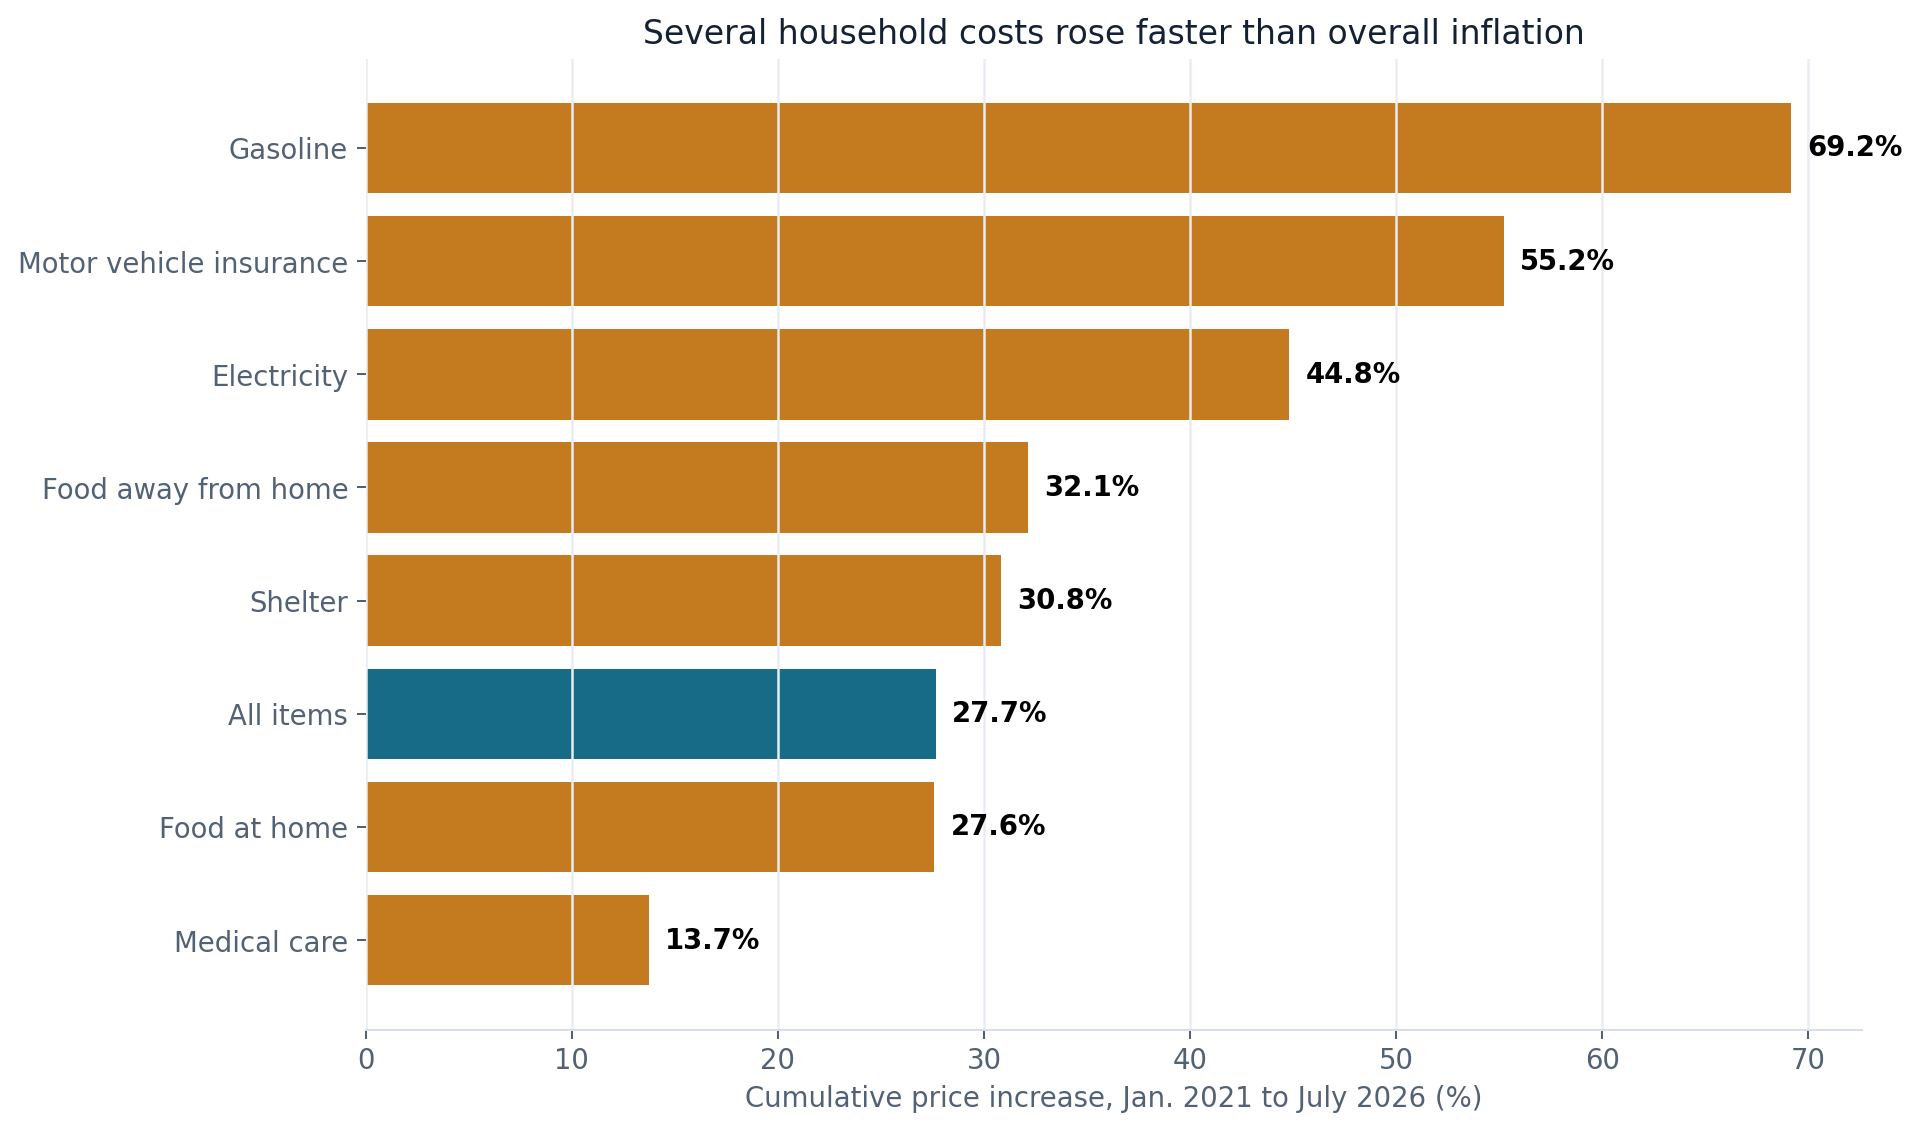
Gasoline was 69.2% above its January 2021 index level, though fuel prices are volatile and the July 2026 index was boosted by a 24.6% increase over the preceding year. Motor vehicle insurance was up 55.2%. Electricity rose 44.8%, food away from home 32.1%, shelter 30.8% and food at home 27.6%. Medical care rose a comparatively smaller 13.7% in the CPI measure.
Those category indexes use the same January 2021-to-July 2026 window as the central comparison. They still do not describe every employee's budget. A renter in New York, a homeowner in rural Texas and a family with substantial medical needs face different weights and may experience different personal inflation.
The category data helps explain why a 14% scheduled raise can feel inadequate even when an employee's own career progression adds more. Costs such as shelter, power and insurance are difficult to avoid, and several outran both the GS base schedule and the sampled locality schedules.
What does the result mean for an individual federal employee?
The clearest conclusion is narrow but consequential: annual pay-table adjustments alone did not preserve the January 2021 purchasing power of a fixed GS grade and step. The loss was about 10.4% on the base table and 7.3% to 9.5% in the sampled locality tables.
Personal outcomes can be better or worse. Within-grade increases move eligible employees through a grade on waiting periods that generally lengthen at higher steps. Promotions and career ladders can produce larger jumps. Special salary rates, recruitment or retention incentives, premium pay and relocation to another locality can also change compensation. An employee who received those increases may have matched or exceeded inflation; one who remained at the same grade and step did not.
It is useful to keep the three concepts separate:
* Pay-schedule purchasing power holds grade and step fixed and asks whether the published rate kept up with prices. It did not. * Individual earnings follow a person's promotions, step increases, hours, premiums, deductions and career choices. This article does not observe those histories. * Average workforce salary reflects both pay changes and who remains in the workforce. Its real value was approximately flat in the public OPM comparison.
None of these measures shows that federal pay caused inflation, or that inflation alone caused changes in federal staffing. They answer a more practical question: after the inflation surge, how much of the scheduled raise survived at the checkout counter? For an employee who did not move up the pay ladder, the answer is roughly nine-tenths.
Readers can compare current opportunities in the federal jobs directory, explore broader federal workforce statistics and follow additional data-driven federal employment reporting.
Methodology and limitations
Reported facts: CPI figures are unadjusted U.S. city average CPI-U index levels from BLS series CUUR0000SA0. July 2026 was the latest official release available on Aug. 19, 2026. Category comparisons use official BLS indexes for food at home, food away from home, shelter, medical care, electricity, gasoline and motor vehicle insurance. The 3.4% latest annual rate is reported by BLS.
FederalHiringData calculations: Cumulative inflation equals July 2026 CPI divided by January 2021 CPI, minus one. GS base adjustments for 2022 through 2026 were compounded from OPM's annual tables; the January 2021 table is the starting index and already incorporates that year's 1% increase. Real change equals the nominal pay factor divided by the CPI factor, minus one. Values are rounded for display, while calculations use unrounded inputs.
Locality comparisons use annual salary tables for Rest of U.S., Washington-Baltimore-Arlington, New York, San Francisco and Los Angeles. Tests covered GS-5 step 1, GS-9 step 5, GS-12 step 5 and GS-13 step 5. These areas were selected before calculating results to span a national residual area and four large locality markets. The national CPI-U is a common benchmark; local inflation experiences are not measured here.
The workforce analysis uses OPM Federal Workforce Data employment files in the local FederalHiringData research warehouse, current through June 2026. Weighted mean annualized adjusted basic pay excludes records with missing or redacted salary values. Grade composition includes GS records with numeric grades, whether or not salary was published. June observations were used to avoid comparing different months. OPM's definition of adjusted basic pay includes basic pay and applicable locality or certain special adjustments; actual earnings can differ because of overtime, differentials, part-time work and leave.
Primary sources: BLS Consumer Price Index, BLS July 2026 release, OPM salary tables, OPM Federal Workforce Data and OPM employment data definitions.
Hero image: A sheet of $100 notes is inspected for quality. U.S. Bureau of Engraving and Printing photograph, a U.S. federal government work.
Keep reading
Related federal hiring research
Article data window: FY2019-FY2025
Contract Spending and Federal Headcount Often Moved Independently
Across a bounded 28-agency sample, contract-obligation growth and covered headcount growth had only a 0.169 correlation; five agencies increased obligations while headcount fell.
Article data window: Jan. 1-14, 2026
Federal Healthcare Hiring Led Early January 2026 Job Announcements
Veterans Health Administration, nurse roles, medical officers, and other clinical and support occupations drove the strongest healthcare signal in the early January archive.
Article data window: Jan. 1-14, 2026
Federal Hiring Trends: Jan. 1-7 vs Jan. 8-14, 2026
Veterans Health Administration stayed dominant, nurse and medical roles strengthened, and remote-work signals remained too sparse for a public trend claim.
Federal Hiring Data Weekly
Subscribe to Federal Hiring Data Weekly.
Subscribe to Federal Hiring Data Weekly. Confirm your email after signing up to receive federal hiring trends, salary data, agency movements, and original research.