August 18, 2026
Retirement Was 38% of Federal Separations in 2025. Quits Were Still More Common.
OPM data record 390,934 federal separation actions in 2025. Retirements accounted for 150,299, while quits remained the largest single category.
By Evan Mercer
Published August 18, 2026Last edited August 18, 2026
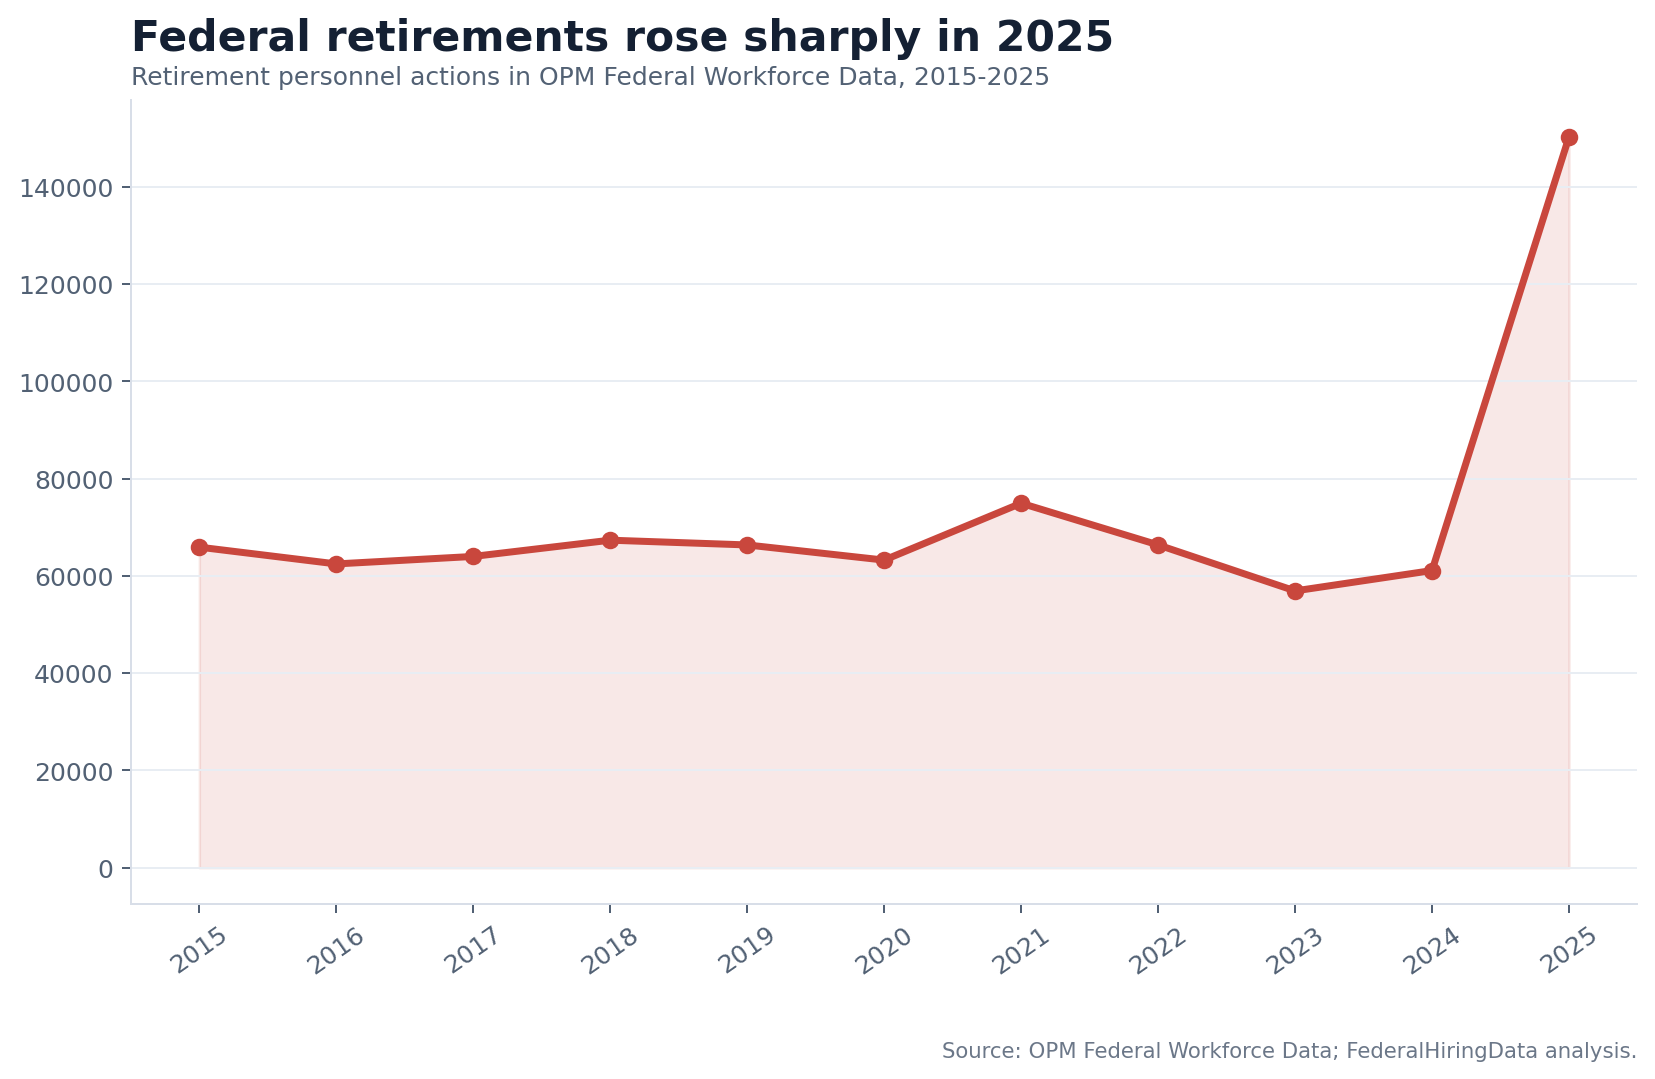
Federal workers left government through more than one door in 2025. OPM's public separations data record 390,934 separation personnel actions during the year. 150,299 were retirements, or 38.4%. Quits were still the largest single category at 163,698.
That distinction answers a recurring federal-workforce question more precisely than a generic turnover number. Retirement mattered enormously in 2025, but it was not the whole story. Expired appointments, transfers, other separations and reductions in force also moved people out of the covered workforce.
| 2025 separation category | Personnel actions | Share |
|---|---|---|
| Quit | 163,698 | 41.9% |
| Retirement - Voluntary | 117,428 | 30.0% |
| Termination (Expired Appt/Other) | 37,970 | 9.7% |
| Retirement - Early Out | 27,638 | 7.1% |
| Other Separation | 16,633 | 4.3% |
| Transfer Out - Individual Transfer | 11,517 | 2.9% |
| Reduction In Force (Rif) | 10,739 | 2.7% |
| Retirement - Other | 5,233 | 1.3% |
| Transfer Out - Mass Transfer | 78 | 0.0% |
Retirement was unusually elevated in 2025
From 2015 through 2024, annual retirement actions in this OPM series ranged from 56,932 to 74,966. The 2025 total of 150,299 was more than double 2024's 61,122. That is a descriptive break in the series, not proof that one policy caused every departure.
OPM's workforce-changes documentation identifies a mix of ordinary retirements and 2025 workforce-reshaping actions. The data categories here separate voluntary retirement, early-out retirement and other retirement from quits and other exits. A personnel action count is not a survey of why an individual made a decision.
The composition matters as much as the headline total. Voluntary retirement accounted for 117,428 actions, while early-out retirement accounted for 27,638. Reductions in force accounted for 10,739. Those categories describe different legal and administrative paths; combining them all under a label such as "layoffs" would erase the distinction visible in the source.
Quits also require care. A quit is a separation action, but the public file does not tell us whether the person moved to another employer, left the labor force, relocated, or had another reason. The data can establish how many actions were coded to each category. It cannot reconstruct each person's motivation.
Which occupations recorded the most retirements
Management and Program Analysis (0343) led the occupational table with 10,783 retirement actions in 2025. Miscellaneous Administration and Program (0301) followed with 10,524, and Information Technology Management (2210) recorded 9,454.
| Series | Occupation | Retirements | All separations |
|---|---|---|---|
| 0343 | Management And Program Analysis | 10,783 | 20,363 |
| 0301 | Miscellaneous Administration And Program | 10,524 | 26,705 |
| 2210 | Information Technology Management | 9,454 | 18,142 |
| No Data Reported | 5,128 | 11,070 | |
| 0201 | Human Resources Management | 3,528 | 7,652 |
| 0610 | Nurse | 3,479 | 9,931 |
| 1101 | General Business And Industry | 3,440 | 7,521 |
| 0501 | Financial Administration And Program | 3,393 | 5,588 |
| 1102 | Contracting | 3,265 | 7,925 |
| 0303 | Miscellaneous Clerk And Assistant | 3,158 | 12,079 |
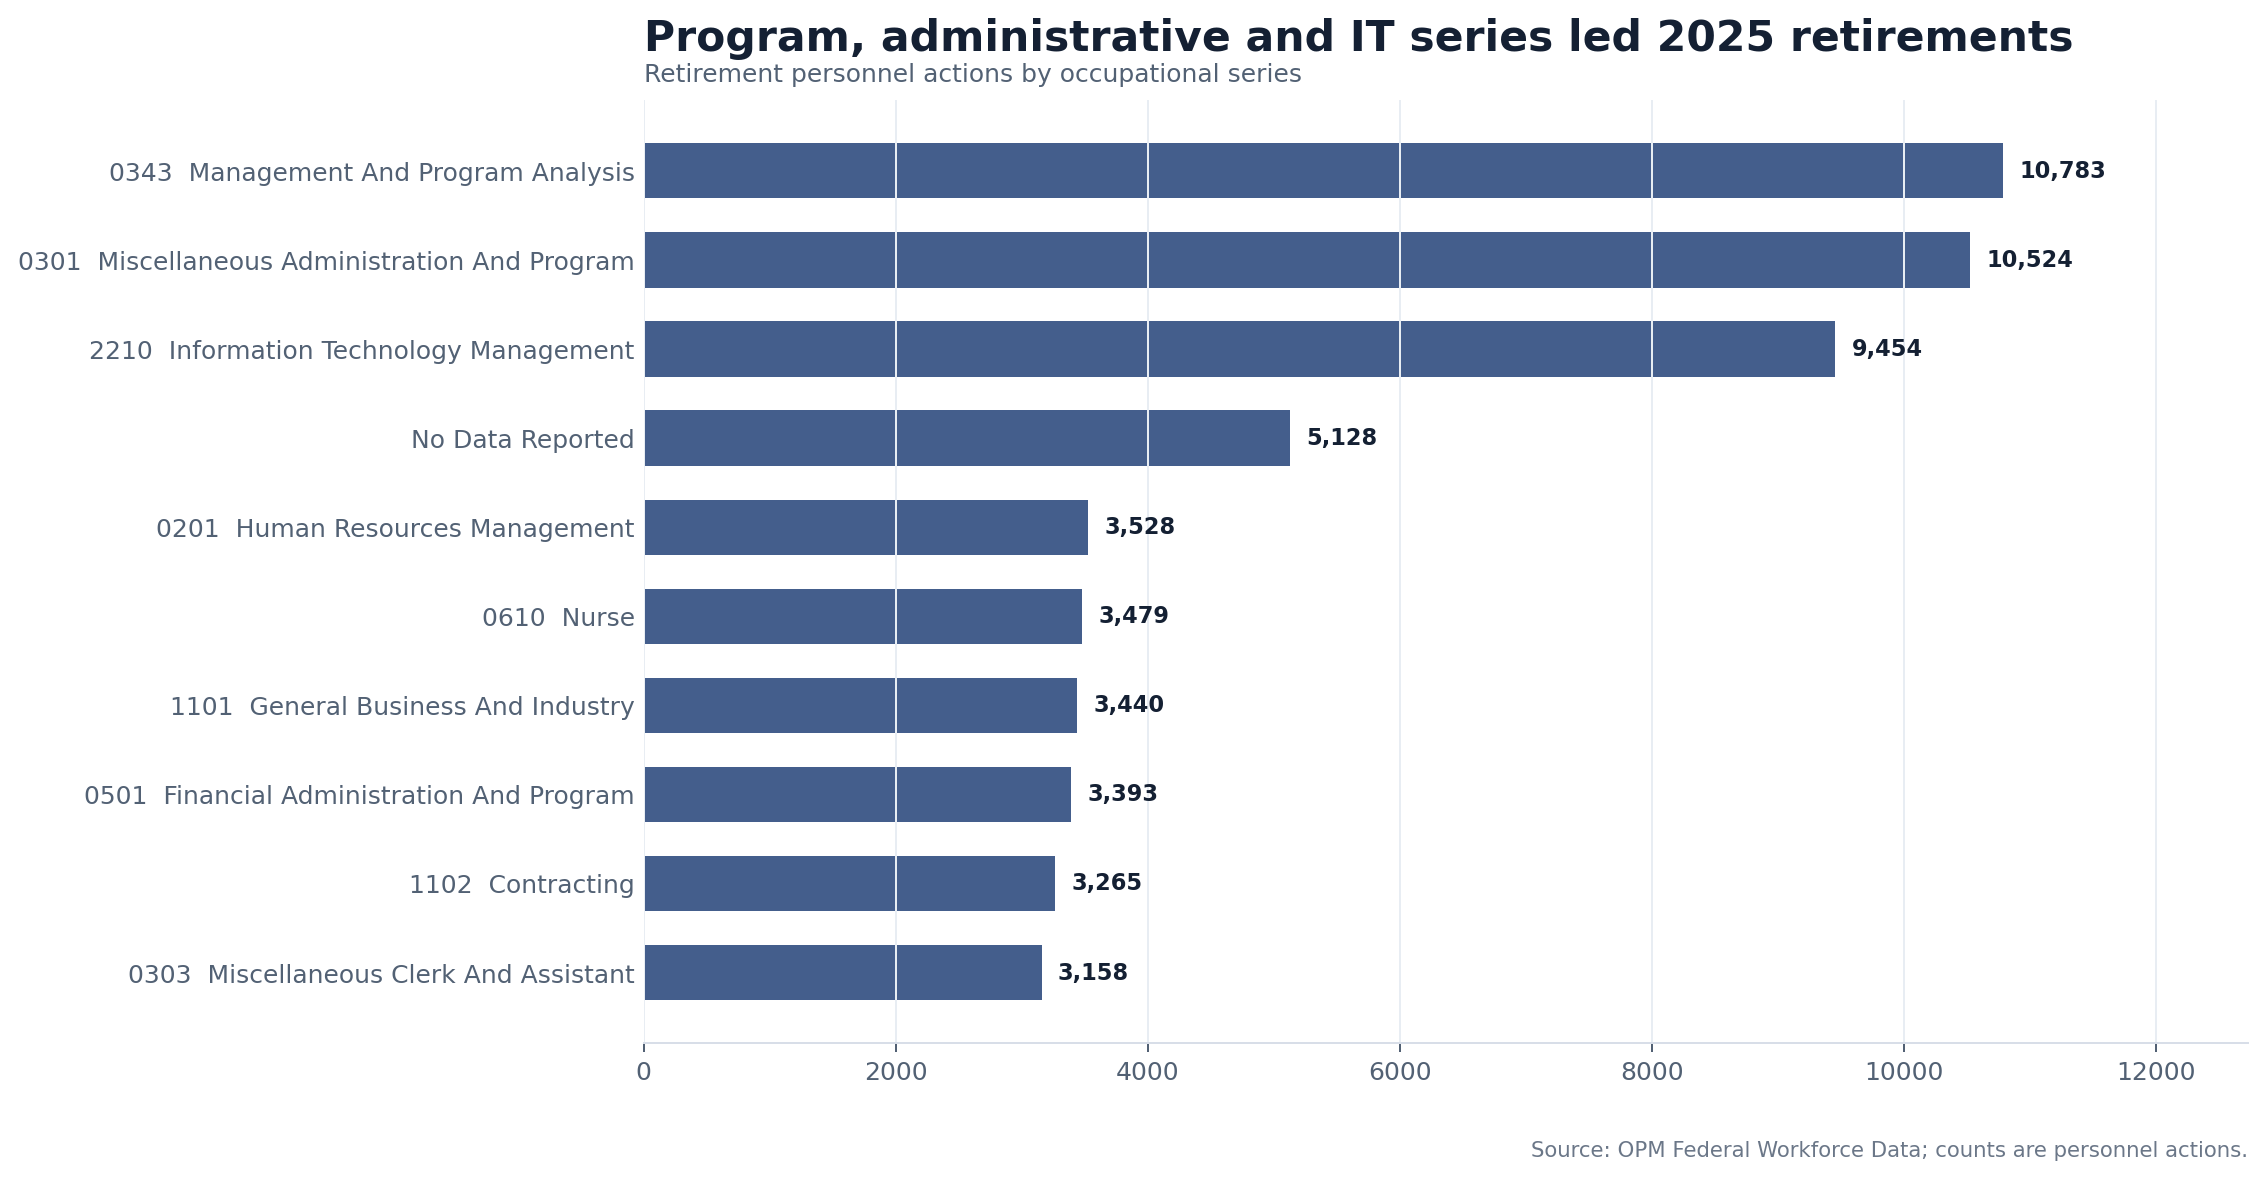
These are counts, not retirement rates. A large occupation can produce many retirements because it has many employees. The table should not be used to say an individual 0343 or 2210 employee was especially likely to retire without a consistent workforce denominator by occupation and month.
Agencies with the largest retirement counts
The Department of Veterans Affairs recorded 16,888 retirement actions. The Army recorded 14,395, Treasury 13,954, and the Navy 12,945.
Large agencies naturally occupy much of this ranking. The counts describe where the greatest number of retirement actions occurred, not which agency offered the best or worst working conditions.
The agency table also should not be used as a vacancy forecast. Veterans Affairs can record more retirements than a much smaller agency while still having a lower retirement rate. A rate analysis would require a consistently matched monthly employment denominator and decisions about which employees were at risk of retirement in each period. This article stays with the cleaner count question raised by the discussion corpus.
What this means for job seekers
Departures can create staffing needs, but a retirement is not a promise that an agency will post a replacement. Managers can abolish a position, reorganize work, hire under a different series, fill internally or leave a vacancy open. USAJOBS announcements measure advertised recruiting, while OPM separations measure personnel actions. They are related signals with different units.
The practical use is to combine them. A series with many retirements and continued announcement volume may deserve attention, but applicants should still search the current job listings, inspect the grade and hiring paths, and confirm that a specific announcement is open.
Methodology and limitations
FederalHiringData summed OPM Federal Workforce Data separation records by action category, calendar year, agency and occupational series. The modern comparison uses complete years 2015 through 2025; 2026 is excluded from the annual chart because the local release is partial. OPM describes these as personnel actions documented through the federal HR system. Coverage and redaction rules are described by OPM Federal Workforce Data and its workforce changes page.
The analysis does not identify employees, predict an individual's retirement, measure morale or claim that every departure produced a vacancy. Forum discussions established demand for the question; they were not used as evidence.
Keep reading
Related federal hiring research
Article data window: FY2019-FY2025
Contract Spending and Federal Headcount Often Moved Independently
Across a bounded 28-agency sample, contract-obligation growth and covered headcount growth had only a 0.169 correlation; five agencies increased obligations while headcount fell.
Article data window: Jan. 1-14, 2026
Federal Healthcare Hiring Led Early January 2026 Job Announcements
Veterans Health Administration, nurse roles, medical officers, and other clinical and support occupations drove the strongest healthcare signal in the early January archive.
Article data window: Jan. 1-14, 2026
Federal Hiring Trends: Jan. 1-7 vs Jan. 8-14, 2026
Veterans Health Administration stayed dominant, nurse and medical roles strengthened, and remote-work signals remained too sparse for a public trend claim.
Federal Hiring Data Weekly
Subscribe to Federal Hiring Data Weekly.
Subscribe to Federal Hiring Data Weekly. Confirm your email after signing up to receive federal hiring trends, salary data, agency movements, and original research.