July 15, 2026
Federal Workforce Was Down 286,000 Workers by May 2026
OPM data available by July 15 showed federal civilian employment still far below late-2024 levels, with accessions lagging separations across much of 2025.
By Federal Hiring Data Research Desk
Published July 15, 2026Last edited August 16, 2026

Federal civilian employment remained far below its late-2024 level in the newest OPM workforce data available by July 15, with the decline broad enough to show up in agencies, occupations, and month-by-month accession and separation records.
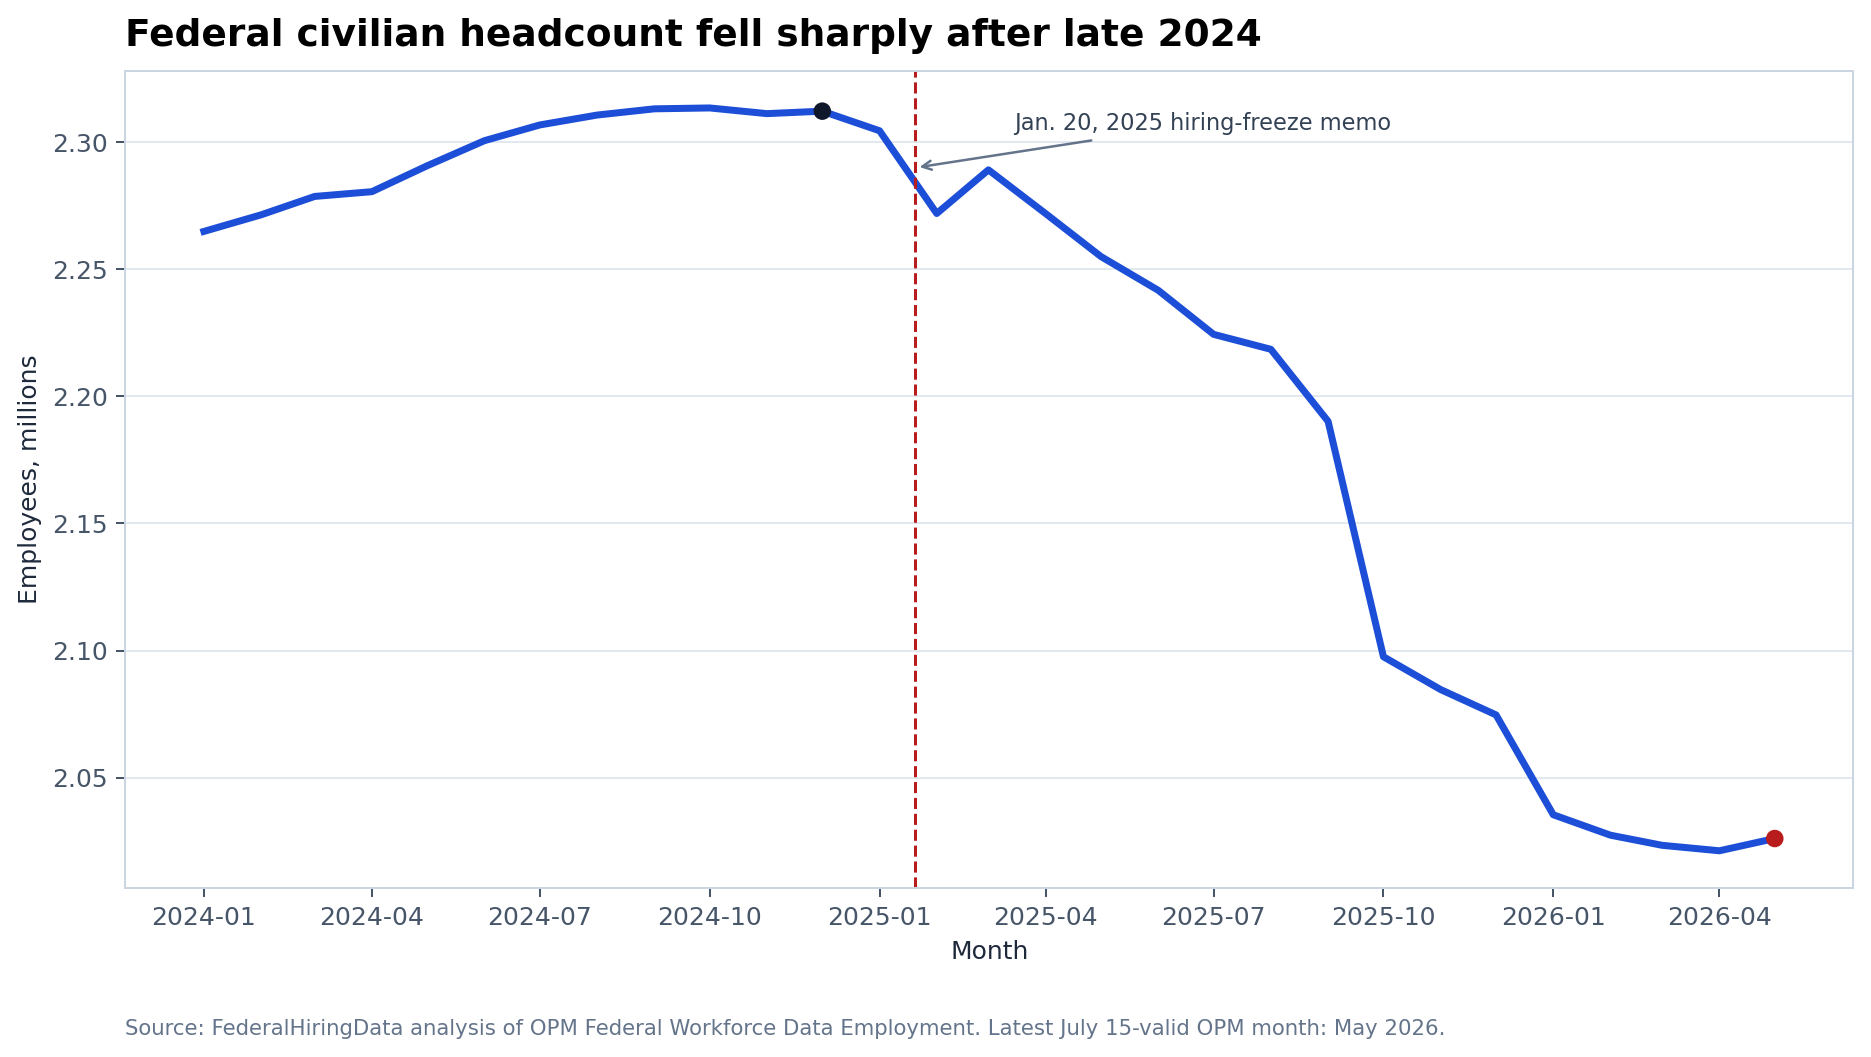
By May 2026, the federal civilian headcount in OPM's Federal Workforce Data stood at 2,025,993, down 286,308 employees, or 12.4%, from December 2024. The same data show 196,499 accessions and 467,286 separations from January 2025 through May 2026, leaving accessions 270,787 below separations over that period.
That does not prove that any single policy caused the decline. It does show that the federal workforce entered mid-2026 in a materially smaller position than it held before the 2025 transition, and that the steepest part of the drop coincided with a period when hiring actions were unusually low and separations were elevated.
The newest valid OPM month was May, not June
This article is dated July 15, 2026. For that date, the latest OPM Employment, Accessions, and Separations files in the local FederalHiringData research catalog that were publicly available were the May 2026 files, published on June 30, 2026. The June 2026 files are present in the current local warehouse, but the catalog records their publication on Aug. 3, 2026, after this article's publication date. They are therefore excluded from the analysis.
The December 2024-to-May 2026 comparison is the cleanest pre/post marker in the monthly data. December 2024 was the last full month before the Jan. 20, 2025 hiring-freeze memorandum, while May 2026 is the newest OPM month available by July 15. The article uses the hiring-freeze date as a timing marker, not as a causal estimate.
Hiring did not keep pace with separations
The clearest operational pattern is not just that headcount fell. It is that accessions did not keep up with separations across much of 2025.
| Period | Accessions | Separations | Accessions per separation | Net accessions minus separations |
|---|---|---|---|---|
| Jan.-May 2024 | 117,476 | 81,317 | 1.44 | 36,159 |
| Jan.-May 2025 | 54,912 | 111,979 | 0.49 | -57,067 |
| Jan.-May 2026 | 69,530 | 76,352 | 0.91 | -6,822 |
In the first five months of 2024, OPM recorded 117,476 accessions and 81,317 separations. In the first five months of 2025, accessions fell to 54,912, while separations rose to 111,979. That means the government recorded about 0.49 accessions for every separation in January-May 2025, compared with 1.44 in the same months of 2024.
By January-May 2026, the replacement ratio had improved to 0.91, with 69,530 accessions against 76,352 separations. That is a less severe imbalance than early 2025, but it still left the workforce below its late-2024 level.
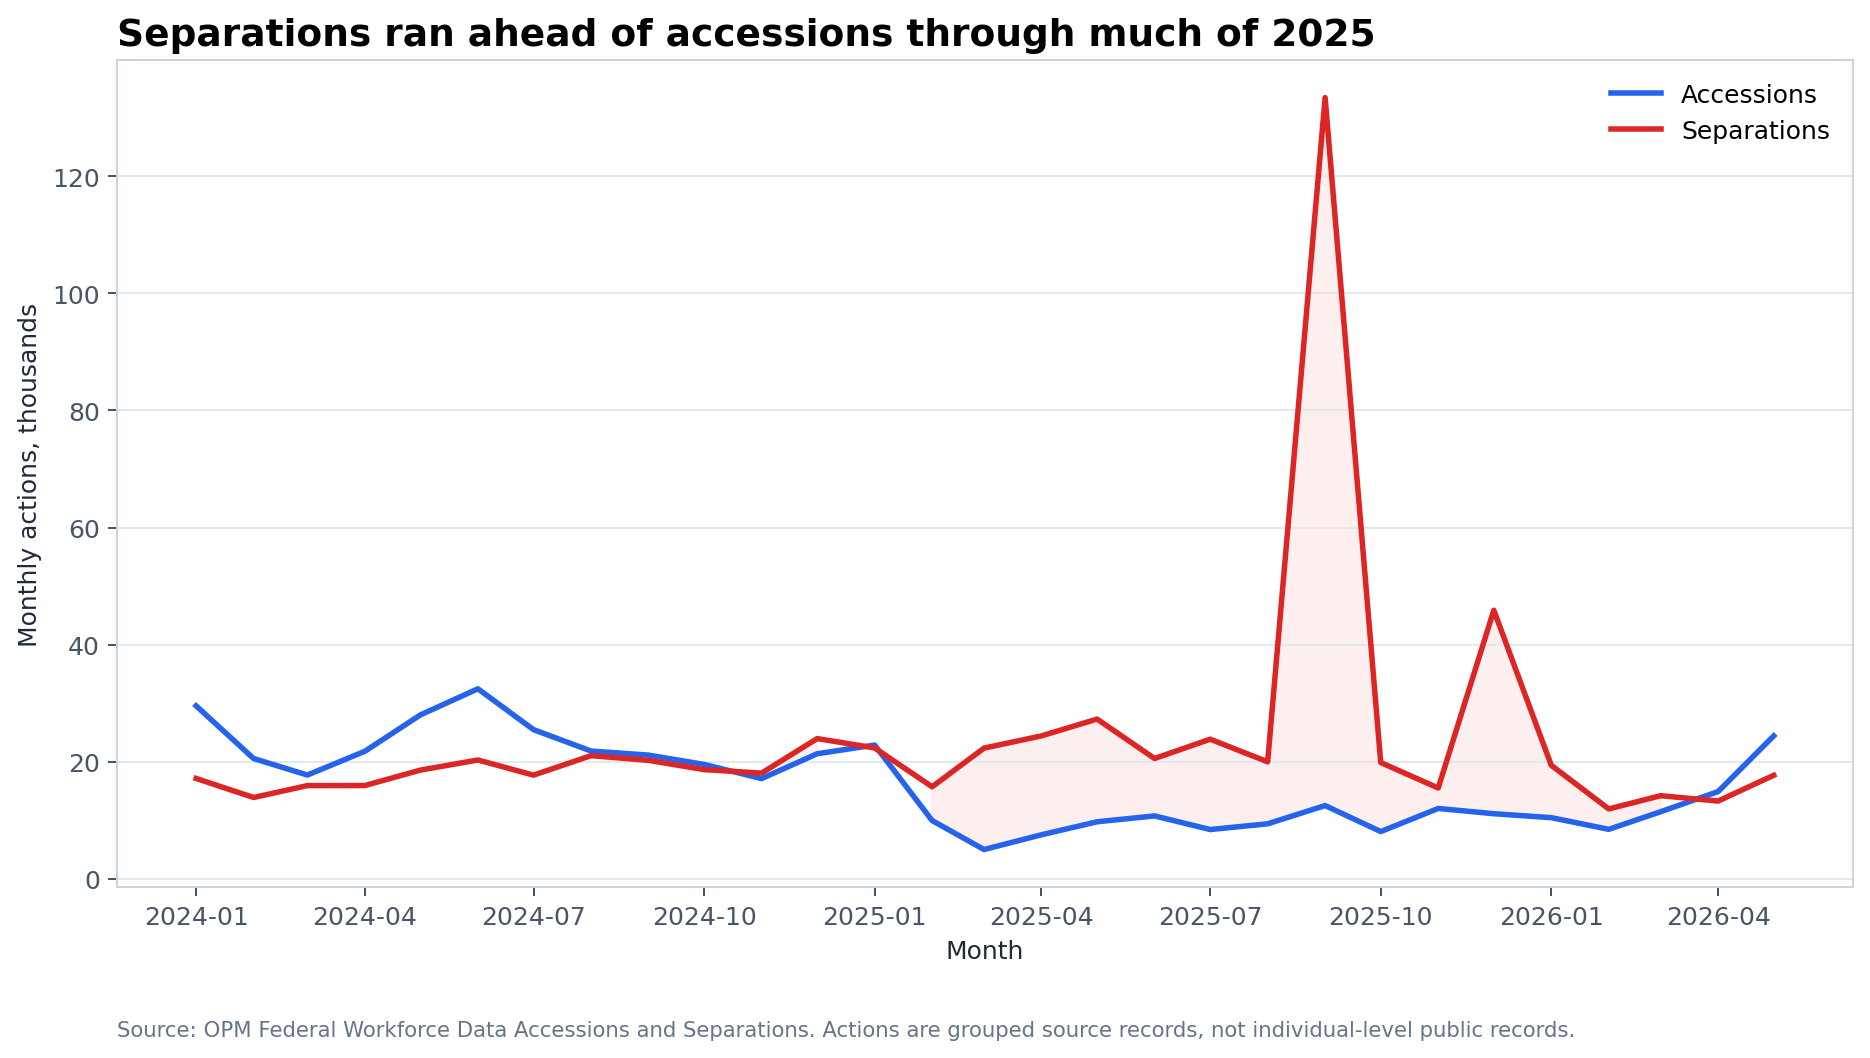
March 2025 stands out in the modern OPM series: accessions fell to 4,969, the lowest monthly accession count from January 2015 through May 2026 in the FederalHiringData warehouse. September 2025 stands out on the other side of the ledger: OPM recorded 133,470 separations and a net accession-minus-separation balance of -120,989, the largest negative monthly balance in the modern monthly series.
Those separation figures are public grouped OPM records. They should not be read as individual-level records, and this analysis does not claim that every action represents a unique person. But at the monthly government-wide level, the magnitude is large enough to explain why the headcount line moved so sharply.
The decline was concentrated, but not narrow
The workforce drop was not evenly distributed. Large agencies with major civilian workforces accounted for much of the absolute decline.
| Agency | Dec. 2024 | May 2026 | Change | Percent change |
|---|---|---|---|---|
| Department Of The Army | 222,831 | 188,336 | -34,495 | -15.5% |
| Department Of Veterans Affairs | 480,075 | 445,660 | -34,415 | -7.2% |
| Department Of Treasury | 117,063 | 84,302 | -32,761 | -28.0% |
| Department Of The Air Force | 173,456 | 151,445 | -22,011 | -12.7% |
| Department Of The Navy | 221,918 | 200,505 | -21,413 | -9.6% |
| Department Of Health And Human Services | 93,035 | 73,186 | -19,849 | -21.3% |
| Department Of Defense | 159,983 | 144,618 | -15,365 | -9.6% |
| Department Of Agriculture | 91,047 | 77,478 | -13,569 | -14.9% |
The Department of the Army and Department of Veterans Affairs each show declines of roughly 34,000 employees from December 2024 to May 2026. Treasury was close behind, down about 32,800. The Air Force, Navy, Health and Human Services, Defense-wide agencies, Agriculture, and Justice also posted large absolute declines.
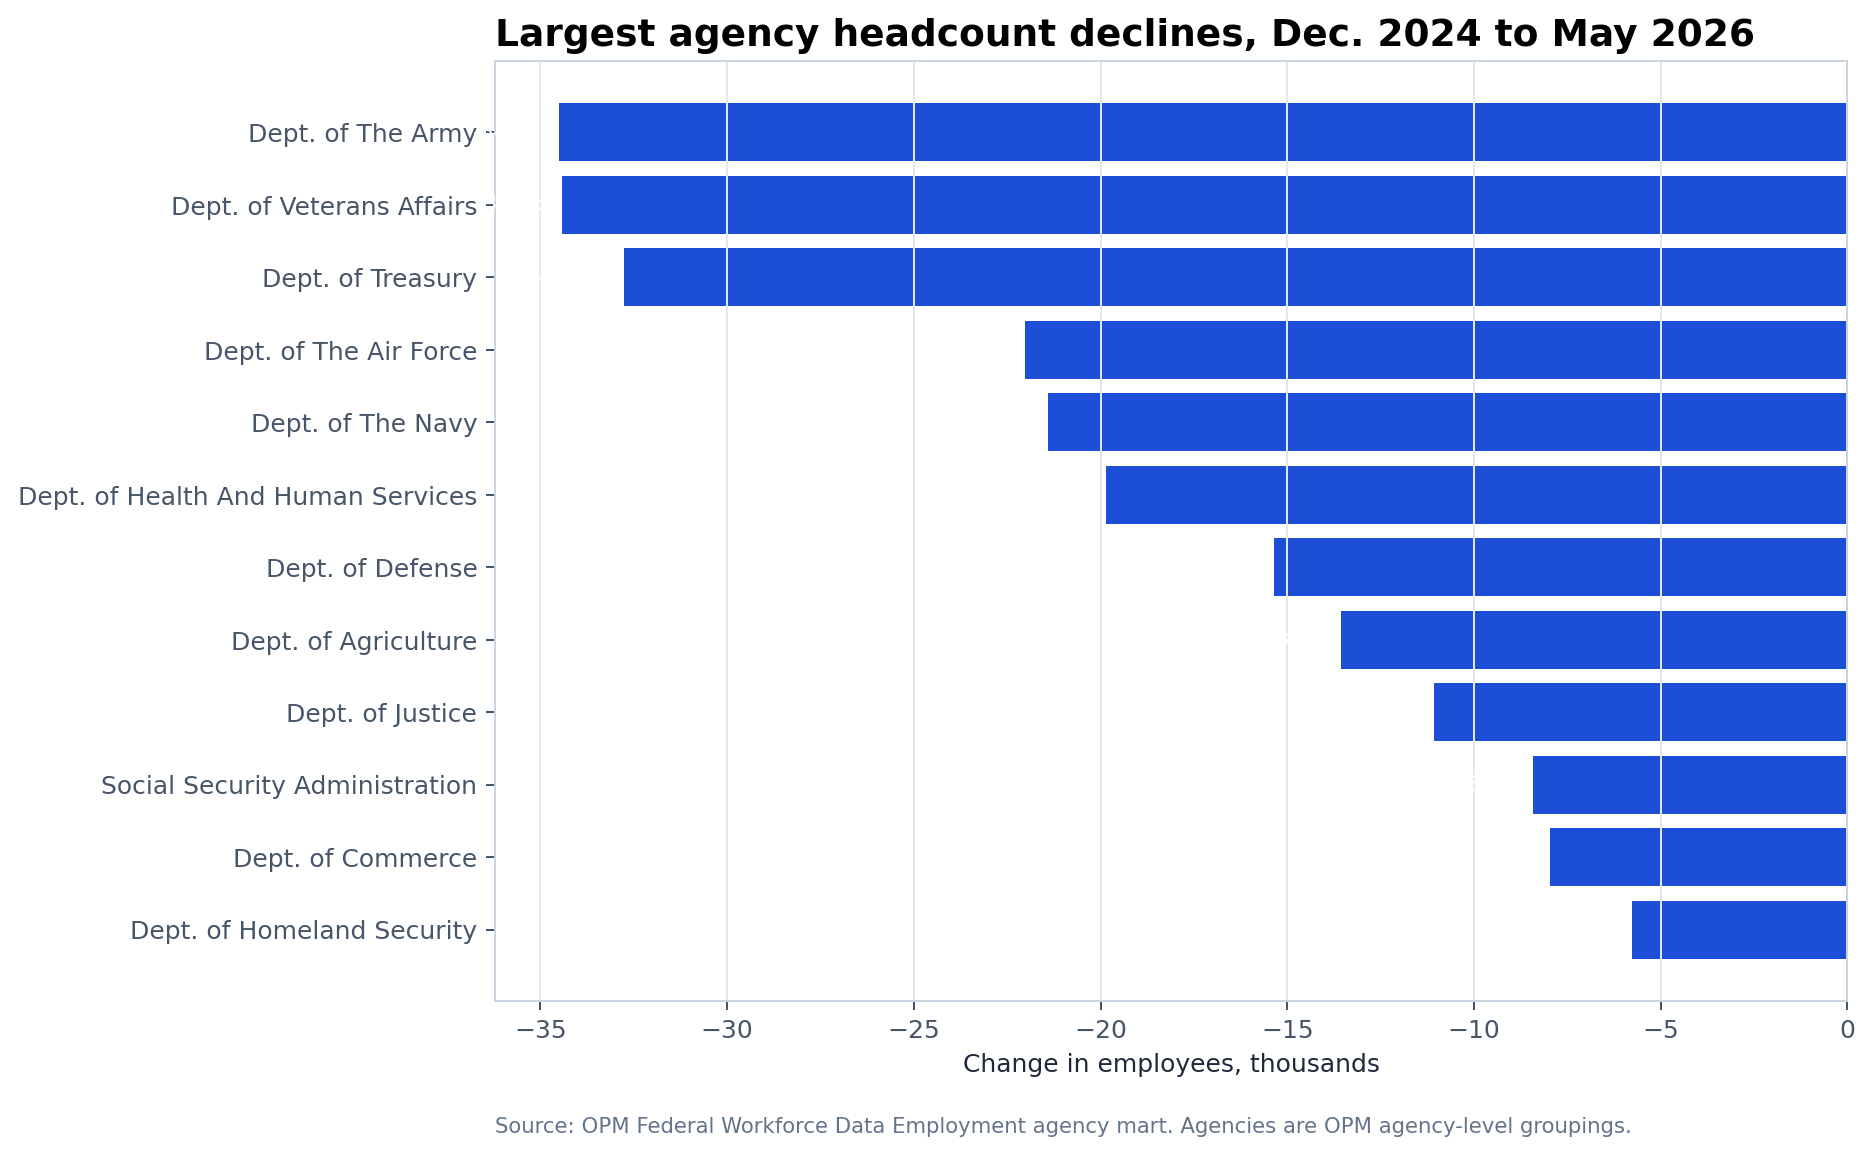
Some smaller agencies saw much larger percentage declines, but the largest absolute changes matter most for the government-wide total. USAID, for example, dropped sharply in percentage terms in the OPM agency-level records, but the Army, VA, Treasury, Air Force, and Navy drove far more of the total headcount change.
The data also show why readers should be careful with agency names. OPM's agency-level groupings do not always match the bureau and component names that appear in USAJOBS announcements. FederalHiringData keeps those concepts separate: OPM agency employment is a workforce measure; USAJOBS announcements are advertised job opportunities.
Administrative, management-analysis and IT series were hit hard
At the occupation level, the largest losses came from broad white-collar series that make up much of the federal government's administrative and professional backbone.
| Occupation series | Dec. 2024 | May 2026 | Change | Percent change |
|---|---|---|---|---|
| Miscellaneous Administration And Program (0301) | 114,470 | 89,536 | -24,934 | -21.8% |
| Management And Program Analysis (0343) | 98,378 | 77,461 | -20,917 | -21.3% |
| Information Technology Management (2210) | 102,085 | 84,355 | -17,730 | -17.4% |
| Miscellaneous Clerk And Assistant (0303) | 46,941 | 35,714 | -11,227 | -23.9% |
| General Attorney (0905) | 44,626 | 36,644 | -7,982 | -17.9% |
| Contact Representative (0962) | 37,734 | 29,793 | -7,941 | -21.0% |
| Human Resources Management (0201) | 42,585 | 35,456 | -7,129 | -16.7% |
| Contracting (1102) | 44,606 | 37,520 | -7,086 | -15.9% |
The Miscellaneous Administration and Program series fell by about 24,900 employees from December 2024 to May 2026. Management and Program Analysis fell by about 20,900, and Information Technology Management by about 17,700.
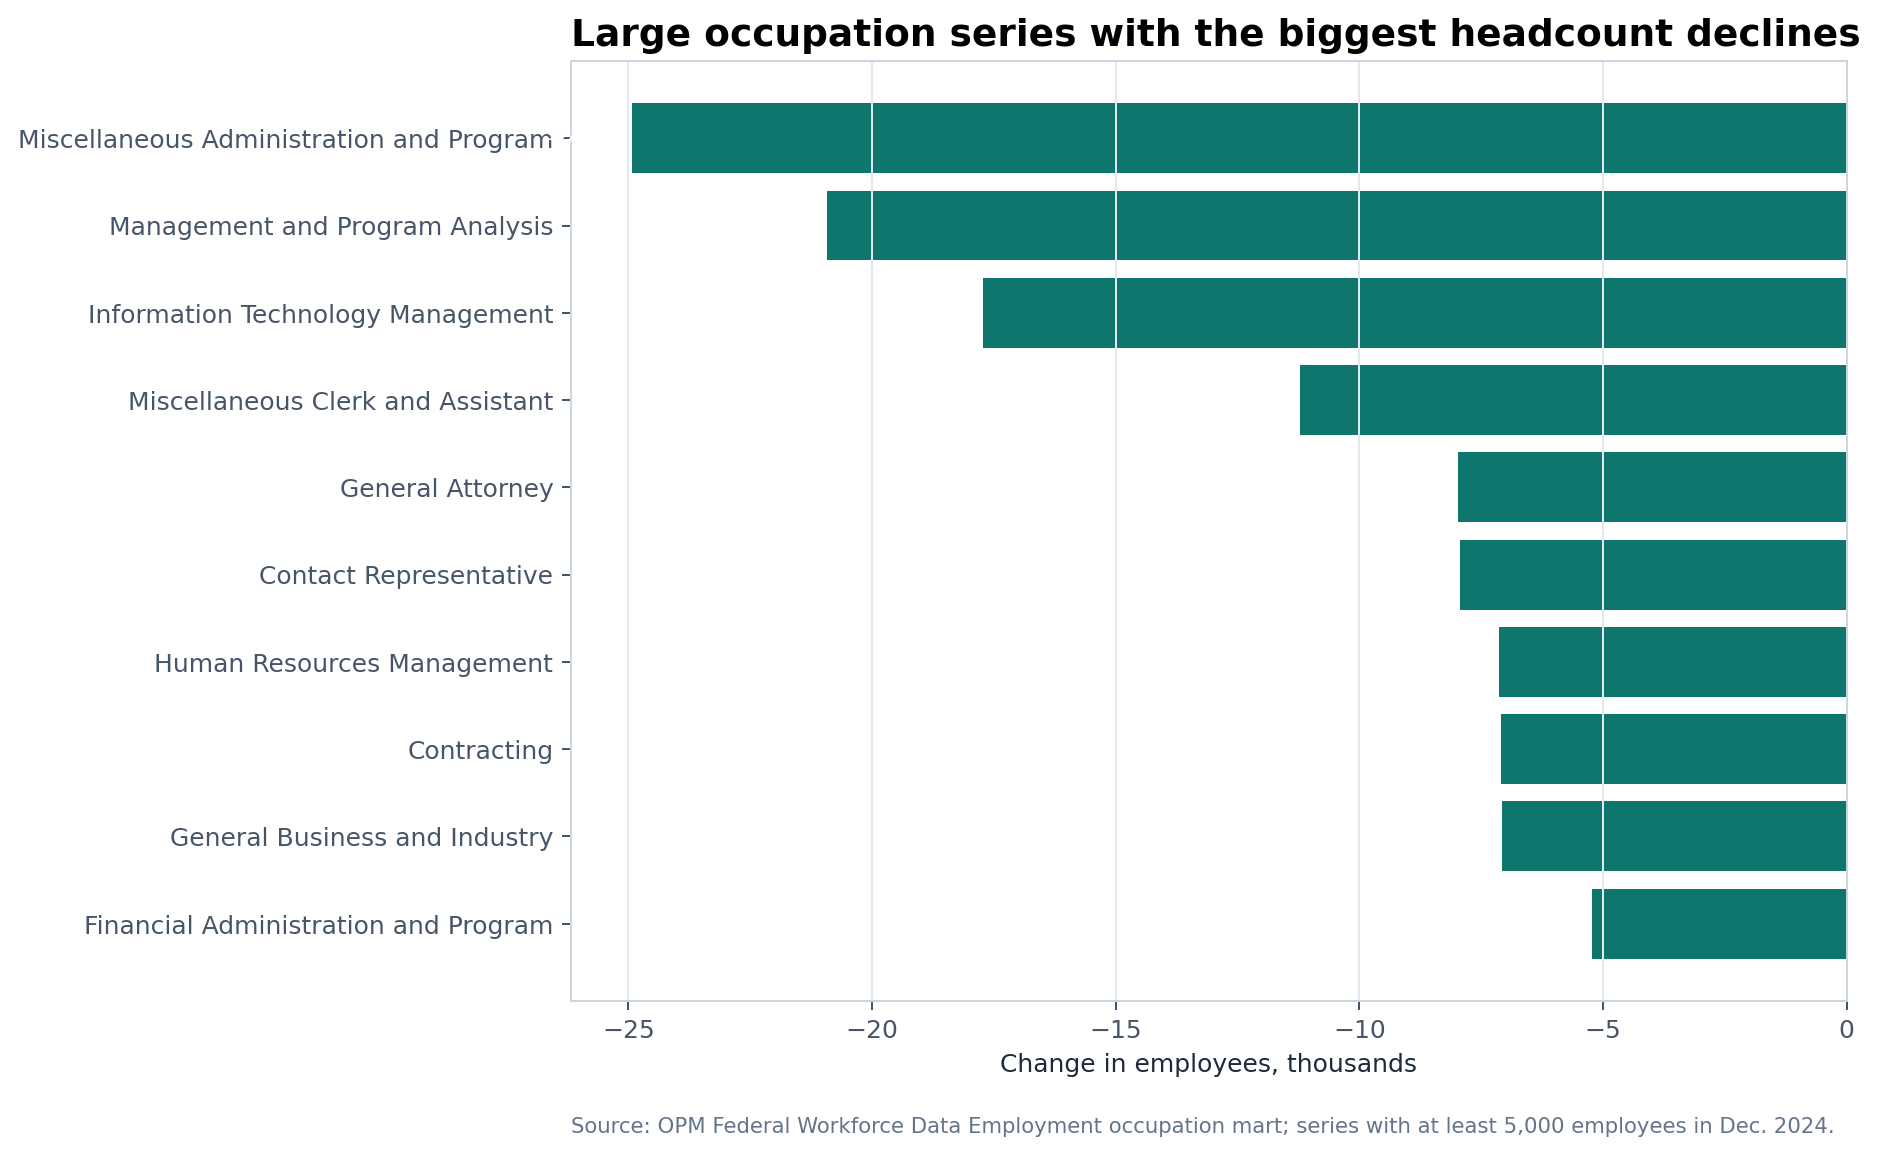
Several mission-critical occupations also declined. Nurse employment was down about 4,400, and Medical Officer employment was down about 3,300 in the same window. Those are smaller percentage declines than some administrative series, but they matter because the federal government continued advertising many clinical roles in USAJOBS announcements during 2026.
That contrast is important: advertised demand and workforce movement are related but not interchangeable. A job announcement can signal need, replacement hiring, seasonal hiring, open-continuous recruitment, or multiple openings. It is not the same thing as a completed accession.
USAJOBS data adds demand context, not a headcount measure
FederalHiringData's USAJOBS archive shows continued job-announcement activity during the same broad period, including healthcare, defense, justice, and revenue-related roles. But this article does not use announcements as a proxy for hires.
The cleanest OPM evidence says the workforce was smaller by May 2026. USAJOBS evidence is useful for understanding where agencies continued to advertise openings and where occupational demand appeared in public announcements. It does not tell us whether those openings were filled, whether a posting represented one position or many, or whether a later workforce count changed because of accessions, separations, transfers, retirements, funding, policy implementation, or other administrative changes.
That distinction is why the headline focuses on workforce headcount and OPM accession/separation records rather than on job postings alone.
What this means
The data support three defensible conclusions as of July 15, 2026.
First, the federal civilian workforce was substantially smaller than it had been before the 2025 transition. The May 2026 OPM count was 286,308 below December 2024 and close to levels last seen around 2014-2015 in the combined FedScope/FWD long-run archive.
Second, the contraction was not just a one-month artifact. The headcount decline was preceded and accompanied by months in which separations exceeded accessions, especially in 2025. Even with some recovery in accessions by 2026, the workforce had not returned to its late-2024 size.
Third, the reduction cut across both agencies and occupations. The biggest absolute changes appeared in very large agencies and broad professional series, not only in small offices or niche occupations.
The data do not establish causation. The timing is consistent with a period of major federal workforce policy change, including the Jan. 20, 2025 hiring-freeze memorandum and related workforce directives. But a causal claim would require a design that separates policy effects from appropriations, retirements, deferred resignation programs, agency-specific implementation, seasonality, mission shifts, and normal turnover.
Methodology and limitations
FederalHiringData analyzed OPM Federal Workforce Data Employment, Accessions, and Separations records in the local OPM/FedScope research warehouse. The latest OPM observation used is May 2026 because the warehouse source-version catalog records the May 2026 OPM files as published June 30, 2026. The June 2026 files were excluded because their recorded publication date is Aug. 3, 2026, after this article's July 15 publication date.
Agency and occupation comparisons use December 2024 and May 2026 OPM grouped records. Agency names are OPM agency-level labels. Occupation series use OPM occupational-series groupings. The article uses FederalHiringData USAJOBS archive data only as announcement context; USAJOBS postings are not hires, OPM duty stations are not USAJOBS advertised locations, and accession or separation action counts should not be treated as individual public personnel records unless the source supports that interpretation.
The headcount measure is federal civilian employment as represented in OPM's public workforce files. It is not a count of contractors, uniformed military personnel, grant-funded workers outside the federal civil service, or state and local employees supported by federal programs. That boundary matters because federal policy debates often use "federal workforce" more loosely than OPM's public employment files do.
Sources include OPM Federal Workforce Data, FederalHiringData's local OPM/FedScope research warehouse, FederalHiringData's USAJOBS archive, the official USAJOBS developer documentation, and the White House Jan. 20, 2025 Hiring Freeze memorandum. Photo: Ian Hutchinson via Unsplash, used under the Unsplash License.
The evidence level for the central finding is DESCRIPTIVE. The agency and occupation comparisons are COMPARATIVE across two OPM monthly snapshots. The timing discussion is a TEMPORAL ASSOCIATION with documented policy dates, not a quasi-causal estimate. FederalHiringData did not use post-July 15 OPM observations as contemporaneous evidence for this article.
Keep reading
Related federal hiring research
Article data window: FY2019-FY2025
Contract Spending and Federal Headcount Often Moved Independently
Across a bounded 28-agency sample, contract-obligation growth and covered headcount growth had only a 0.169 correlation; five agencies increased obligations while headcount fell.
Article data window: Jan. 1-14, 2026
Federal Healthcare Hiring Led Early January 2026 Job Announcements
Veterans Health Administration, nurse roles, medical officers, and other clinical and support occupations drove the strongest healthcare signal in the early January archive.
Article data window: Jan. 1-14, 2026
Federal Hiring Trends: Jan. 1-7 vs Jan. 8-14, 2026
Veterans Health Administration stayed dominant, nurse and medical roles strengthened, and remote-work signals remained too sparse for a public trend claim.
Federal Hiring Data Weekly
Subscribe to Federal Hiring Data Weekly.
Subscribe to Federal Hiring Data Weekly. Confirm your email after signing up to receive federal hiring trends, salary data, agency movements, and original research.