January 10, 2025
Medical Officer Roles Set the Highest Federal Salary Ceilings in Early January 2025
Early January 2025 salary records showed Medical Officer announcements with the highest average salary ceilings among sizable federal occupation series.

Medical roles occupied the top of the advertised salary range in early January 2025. In a FederalHiringData snapshot of 7,745 January-closing announcements through Jan. 10, Medical Officer (0602) records had an average normalized maximum salary of about $339,222 and a highest advertised maximum of $400,000.
That is a salary ceiling, not a salary promise. The number comes from announcement maximums after normalization, and many federal medical roles use special pay rules, market pay, locality pay, recruitment authorities, or other structures that do not behave like a single GS step table.
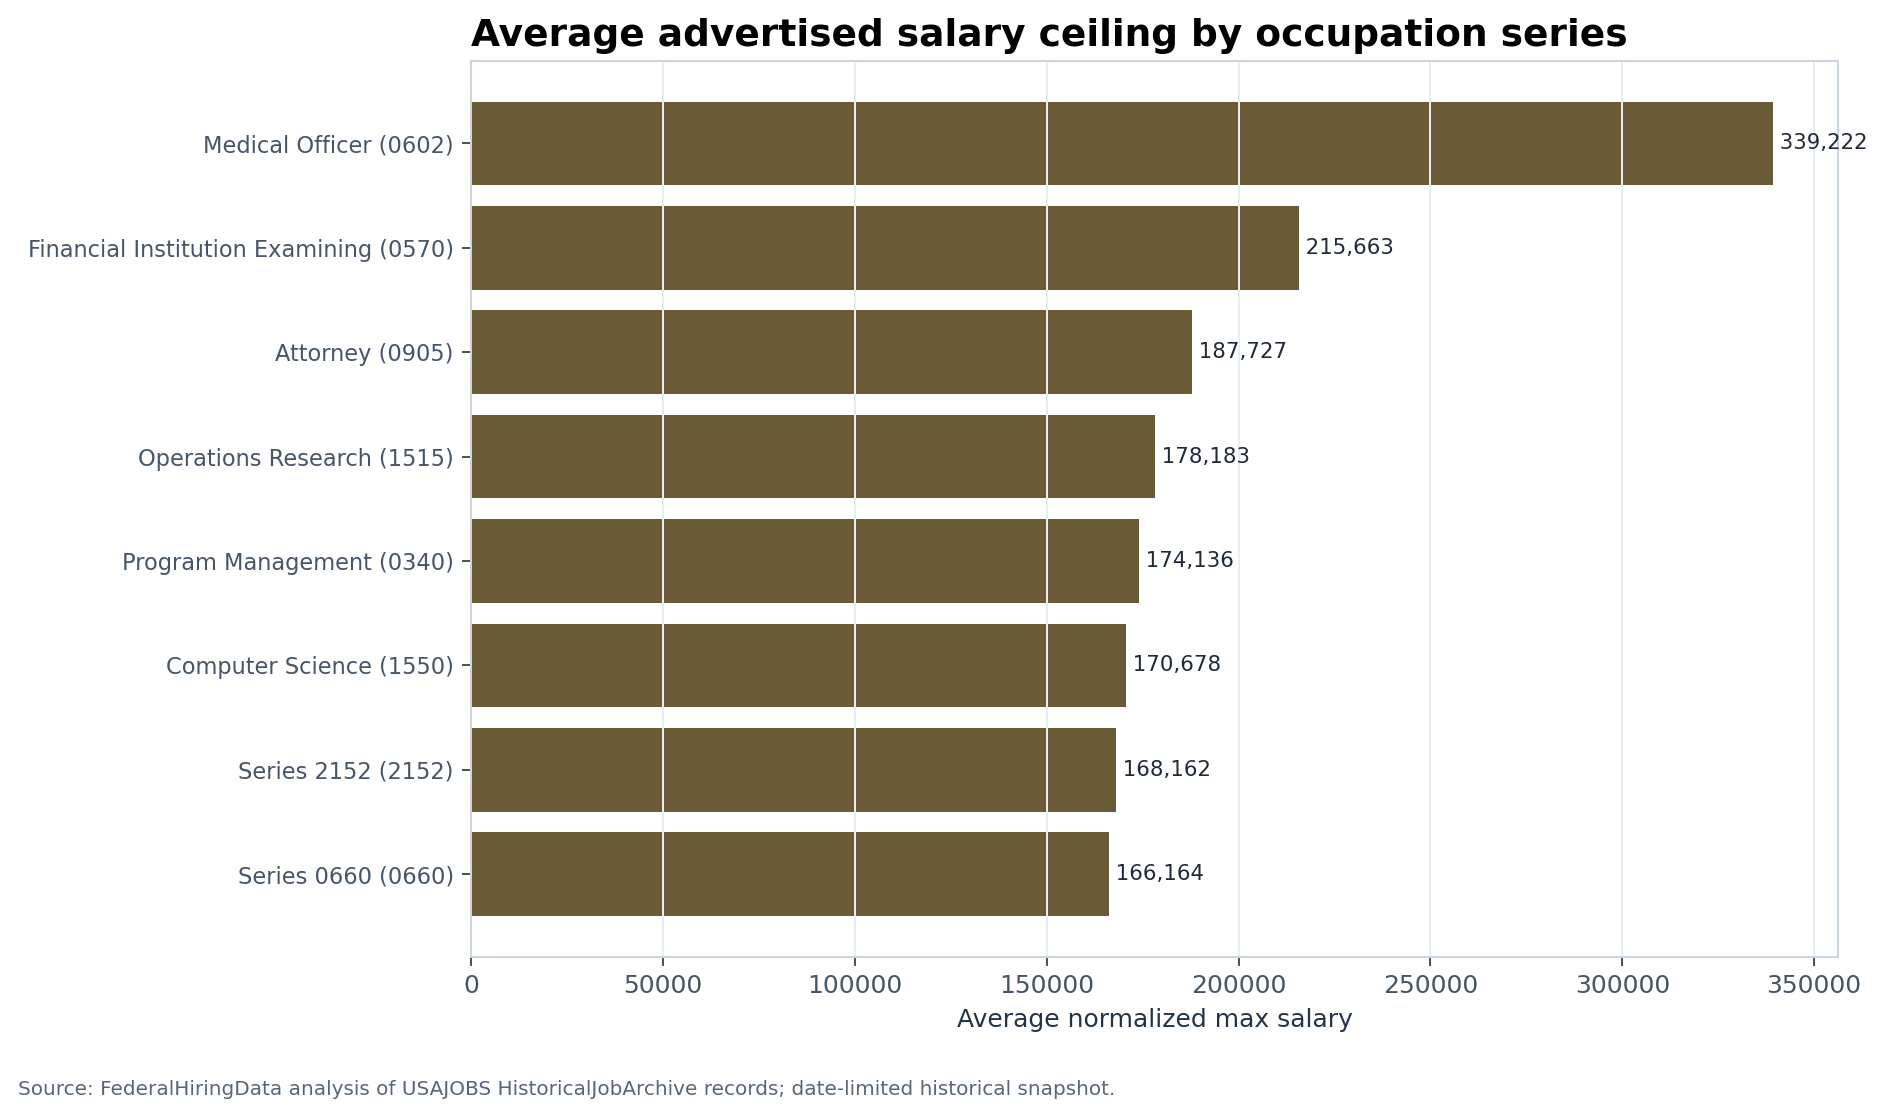
Highest salary ceilings in the snapshot
| Series | Records | Avg. max salary | Median max | Highest max |
|---|---|---|---|---|
| Medical Officer (0602) | 76 | $339,222 | $325,000 | $400,000 |
| Financial Institution Examining (0570) | 31 | $215,663 | $231,669 | $302,200 |
| Attorney (0905) | 82 | $187,727 | $191,900 | $284,600 |
| Operations Research (1515) | 33 | $178,183 | $191,900 | $221,900 |
| Program Management (0340) | 91 | $174,136 | $181,216 | $250,360 |
| Computer Science (1550) | 21 | $170,678 | $181,216 | $195,200 |
| Series 2152 (2152) | 29 | $168,162 | $173,042 | $221,900 |
| Series 0660 (0660) | 26 | $166,164 | $169,552 | $204,472 |
The list is dominated by clinical, legal, analytical, and technical professional work. Medical Officer sits far above the other high-salary series in the Jan. 10 snapshot. Financial Institution Examining, Attorney, Operations Research, Program Management, and Computer Science also appear among the top salary-ceiling categories.
Why medical officer roles sit at the top
Federal medical roles are a special case in public salary data. Physician announcements can include maximums designed for hard-to-fill specialties, geographic markets, and clinical compensation structures. Veterans Health Administration and other federal health-care employers compete in labor markets where private-sector pay, specialty credentials, and facility needs matter.
That is why the Medical Officer series can produce salary ceilings near $400,000 while many high-volume administrative series sit far lower. The archive is measuring what agencies advertised, not what every selected applicant ultimately earned.
Average max salary is not the same as typical pay
Average maximum salary can be useful, but it has limitations. It can be pulled upward by a small number of high-ceiling announcements. It does not account for whether a role is full-time, part-time, intermittent, remote, overseas, open-continuous, or tied to special pay.
Median maximum salary helps reduce the effect of outliers, and the Jan. 10 snapshot still shows Medical Officer above $300,000 by median advertised maximum. That supports the central finding while keeping the interpretation narrow.
What job seekers should do with salary ceilings
Applicants should read the full announcement, not just the maximum salary line. Pay can depend on grade, step, locality, appointment type, specialty, board certification, incentive eligibility, and duty station. Some announcements also list broad ranges because they cover multiple grades or multiple locations.
For comparison shopping, a salary ceiling is best used as a clue. It tells the reader which categories had high advertised upper bounds. It does not tell the reader their offer amount, their negotiating room, or whether they would qualify for the highest level.
What the early-January data says
The early-January salary picture was clear enough for a public article because the top category was not marginal. Medical Officer records led by a wide margin, and several other high-paying categories had enough records to show up consistently. But the article should still be treated as a snapshot, not as a complete salary atlas for the federal government.
Methodology and limitations
This article is a FederalHiringData historical reconstruction. It uses USAJOBS HistoricalJobArchive records with announcement close dates on or before 2025-01-10. The analysis date shown to readers is 2025-01-10; the actual publication timestamp is preserved separately in the production Article row and in Article schema metadata.
The dataset counts job announcements, not hires, selections, applicants, certificates, or filled positions. A single announcement may represent one vacancy, many vacancies, or a continuing recruitment need. FederalHiringData normalizes fields such as agency, occupation series, salary range, location count, and open/close dates where the source data supports it, but the underlying announcement text remains the controlling source.
The article uses 7,745 archive records in its primary snapshot. Historical USAJOBS announcements can be amended, cancelled, or structured differently across agencies. Salary maximums are advertised maximums from normalized announcement data and should not be read as guaranteed pay for any applicant. Advertised locations are not the same as OPM duty-station employment counts.
The historical-as-of date is a reporting cutoff, not a claim that this web page existed on that date. FederalHiringData preserved the actual publication and edit timestamps in the article record and uses the January 2025 date to tell readers which archive slice the analysis reflects. Question Intelligence helped select the topic because people search for these answers, but forum posts are not used as evidence for the numerical claims.
Null or ambiguous source fields are not silently converted into confident labels. When the article describes agency, occupation, salary, duration, or location patterns, it is describing the normalized rows available for that specific cutoff. Later backfills can improve coverage, but this pilot avoids retroactively using later January or later-year data in articles assigned to earlier January cutoffs.
Sources: FederalHiringData HistoricalJobArchive; USAJOBS; USAJOBS API documentation. Photo: Jake Kling via Unsplash, used under the Unsplash License.
Keep reading
Related federal hiring research
Article data window: FY2019-FY2025
Contract Spending and Federal Headcount Often Moved Independently
Across a bounded 28-agency sample, contract-obligation growth and covered headcount growth had only a 0.169 correlation; five agencies increased obligations while headcount fell.
Article data window: Jan. 1-14, 2026
Federal Healthcare Hiring Led Early January 2026 Job Announcements
Veterans Health Administration, nurse roles, medical officers, and other clinical and support occupations drove the strongest healthcare signal in the early January archive.
Article data window: Jan. 1-14, 2026
Federal Hiring Trends: Jan. 1-7 vs Jan. 8-14, 2026
Veterans Health Administration stayed dominant, nurse and medical roles strengthened, and remote-work signals remained too sparse for a public trend claim.
Federal Hiring Data Weekly
Subscribe to Federal Hiring Data Weekly.
Subscribe to Federal Hiring Data Weekly. Confirm your email after signing up to receive federal hiring trends, salary data, agency movements, and original research.