August 20, 2026
Social Security Has 85% More Beneficiaries per Worker Than in 2000
Social Security added 25 million beneficiaries while losing 9,600 full-time permanent workers. Recent service gains show what technology changed—and what a thinner workforce still risks.
By Evan Mercer
Published August 20, 2026Last edited August 20, 2026

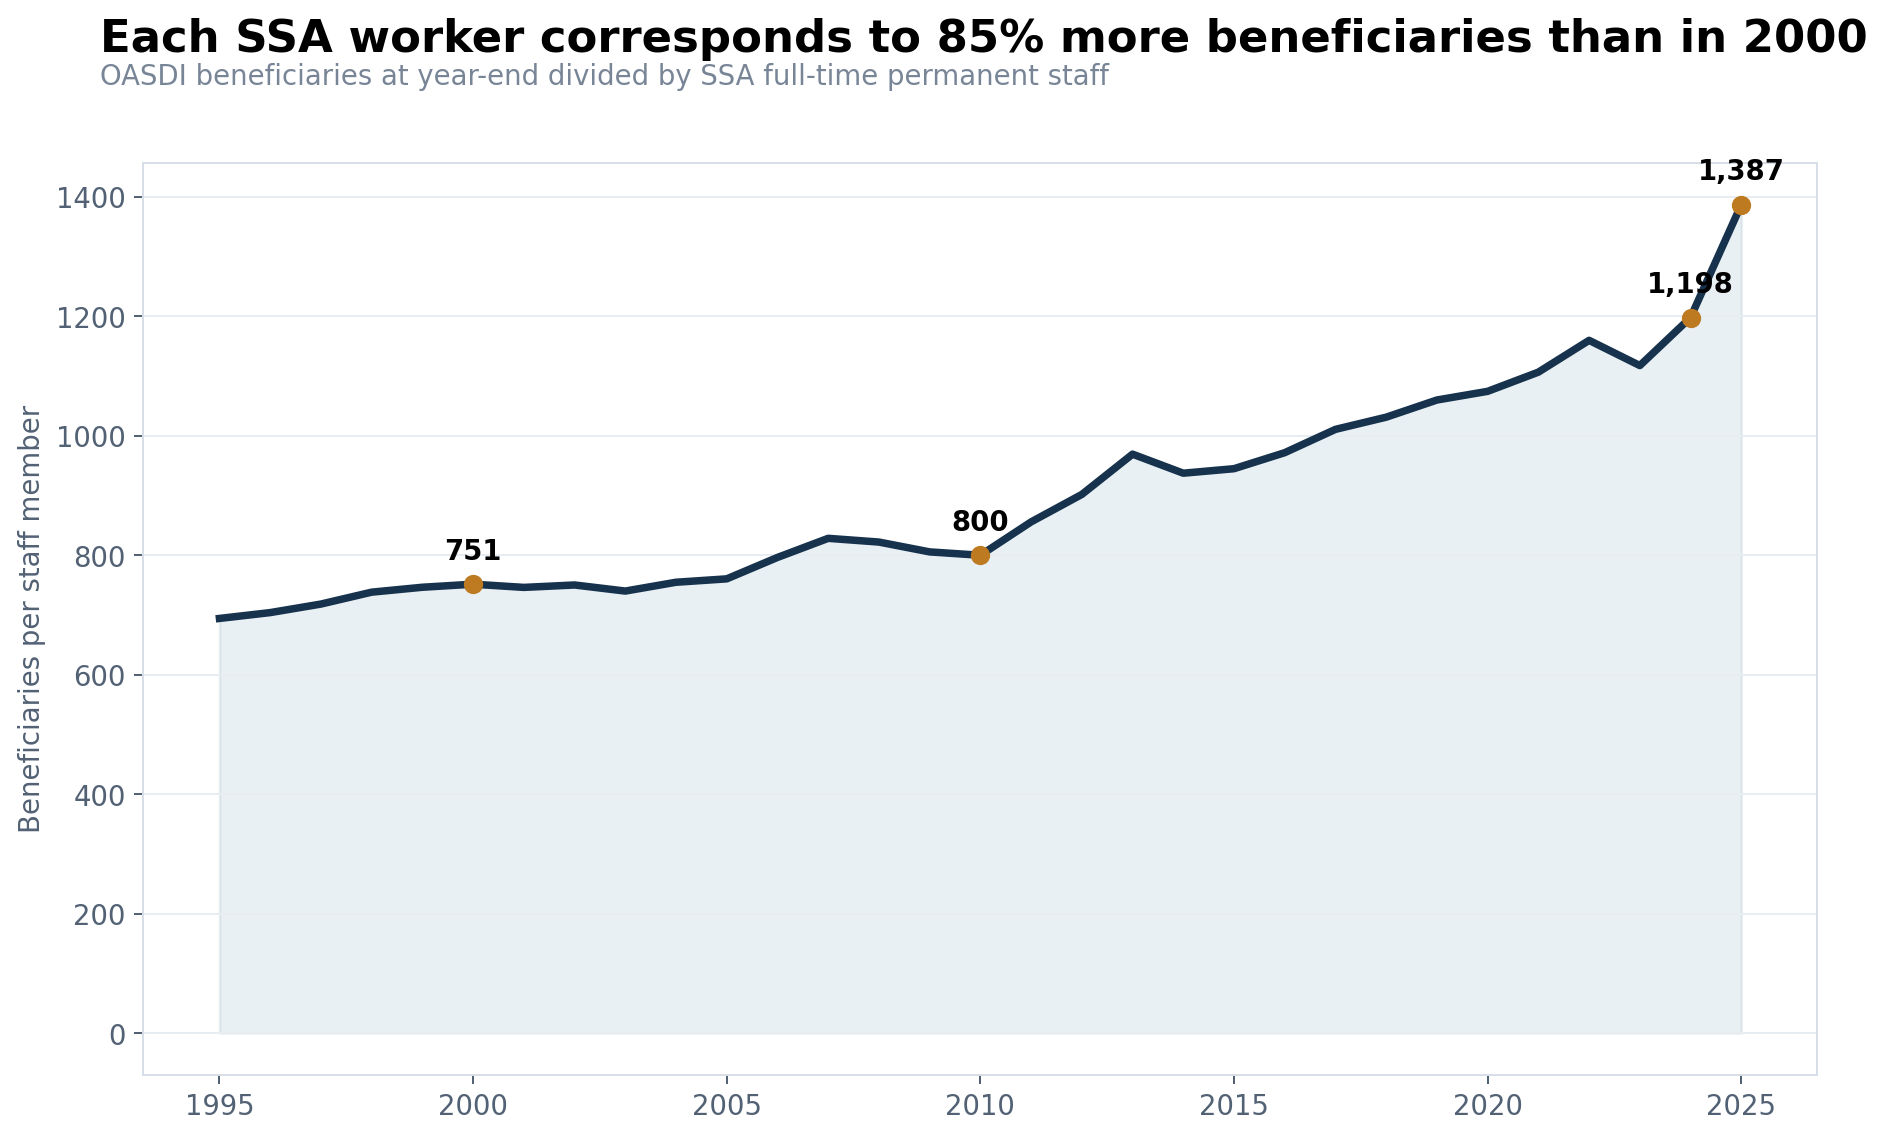
In 2000, there were about 752 Social Security beneficiaries for every full-time permanent employee at the agency. By 2025, there were 1,387.
That 84.5% increase is not a literal caseload. A retiree whose monthly payment arrives without trouble may have no contact with the Social Security Administration all year, while a person applying for disability benefits can require months of document gathering, medical review and appeals. Still, the ratio captures a change in scale that no call-center anecdote can: the system added 25 million beneficiaries while the workforce administering it became smaller.
The Social Security Administration's beneficiary records show 70.45 million people receiving Old-Age, Survivors and Disability Insurance benefits at the end of 2025, up 55.1% from 45.41 million in 2000. SSA had 50,801 full-time permanent employees in fiscal 2025, down 15.9% from 60,434 in 2000.
The imbalance did not begin with the 2025 restructuring. Beneficiary growth has outrun staffing for most of this century. But the latest reduction was unusually steep. An April 2026 agency report counted 48,430 full-time permanent employees, below every annual value in SSA's published series going back to 1995.
There is an important complication. A smaller workforce has not produced uniformly worse service. Phone waits, field-office waits and disability-processing times improved in the latest official measures, while online transactions reached a new high. Social Security is serving more people with fewer workers. The evidence also shows that it has become more productive in some channels. The unresolved question is how durable those gains will be after losing experienced claims, contact, legal and technology staff while the beneficiary population keeps growing.
| Measure | 2000 | 2025 | Change |
|---|---|---|---|
| OASDI beneficiaries | 45,414,705 | 70,451,490 | +55.1% |
| SSA full-time permanent staff | 60,434 | 50,801 | -15.9% |
| Beneficiaries per staff member | 751.5 | 1,386.8 | +84.5% |
| Employees per 100,000 beneficiaries | 133.1 | 72.1 | -45.8% |
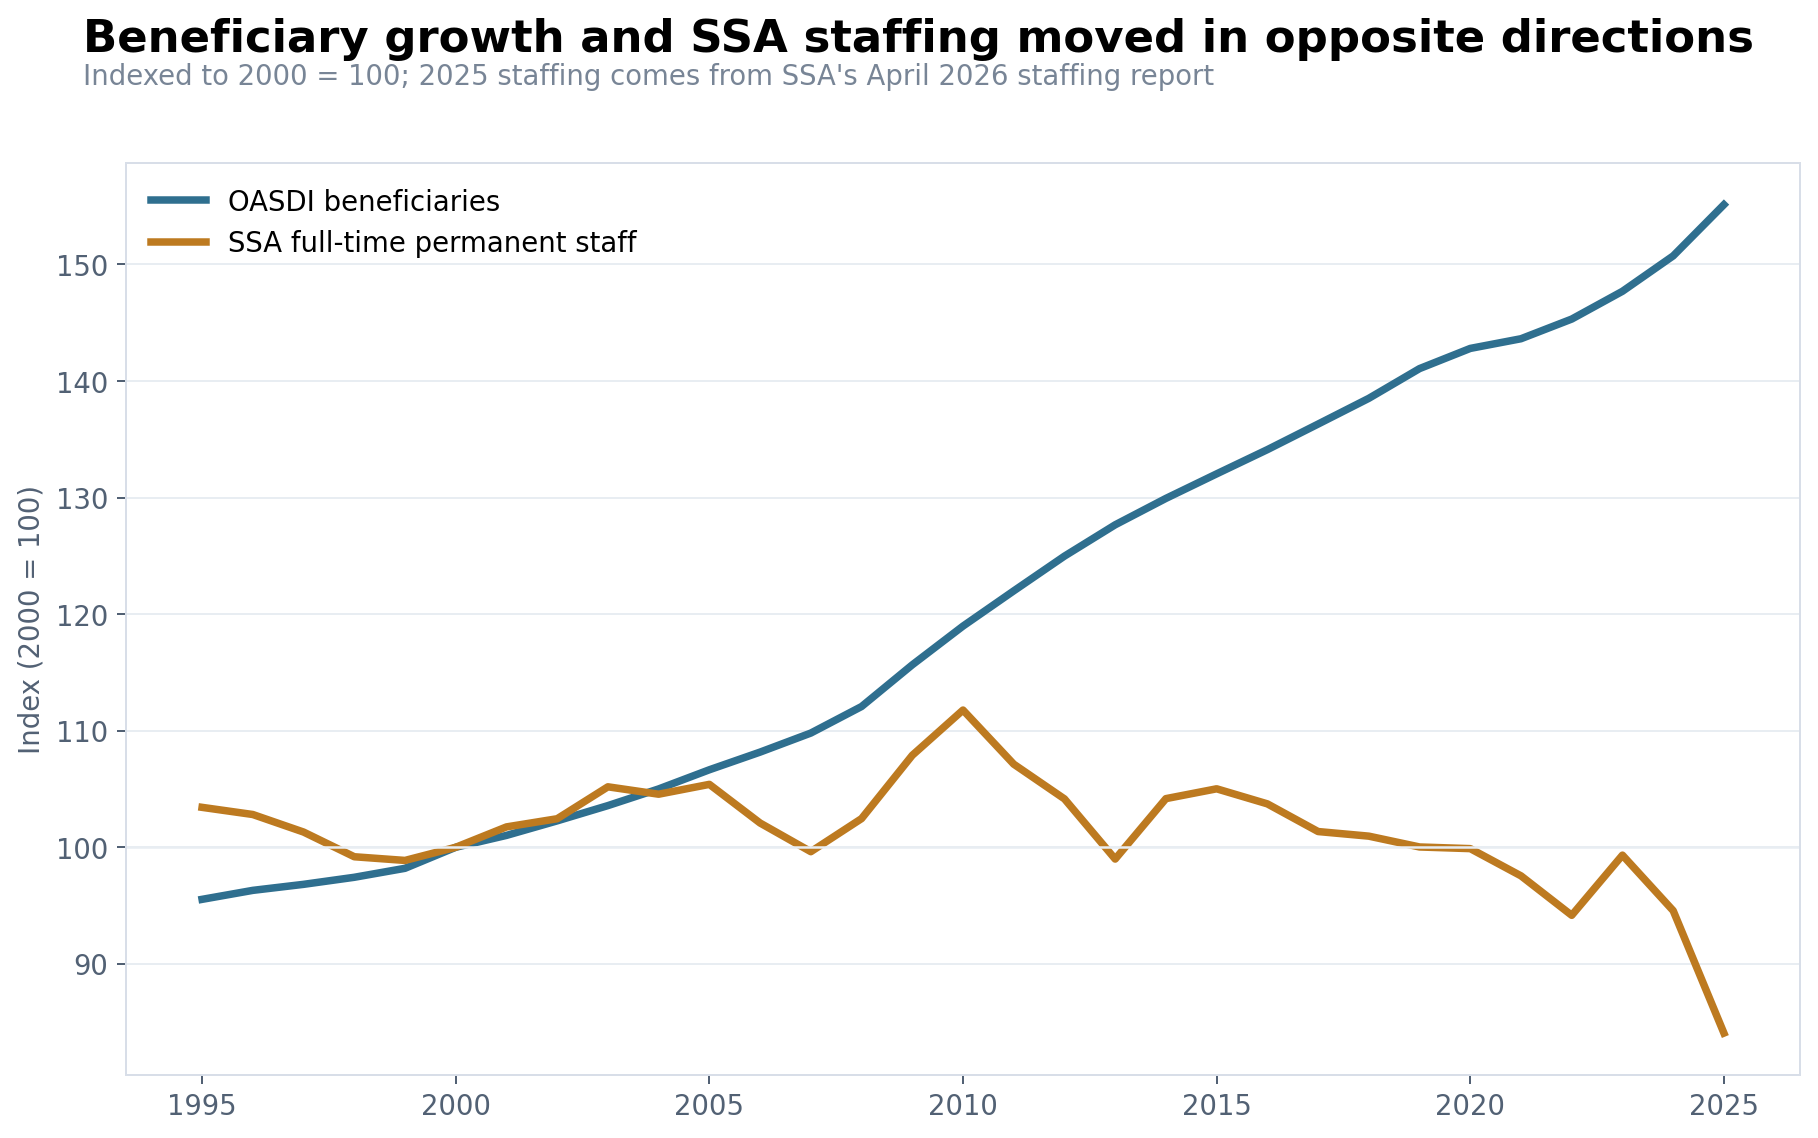
How did the gap take decades to build, then widen quickly?
SSA's full-time permanent workforce stood at 60,434 in 2000. It climbed to 67,548 in 2010, when the agency was handling recession-era claims and growing disability rolls, then receded. Staffing fell below 60,000 in 2013, briefly recovered, and reached 57,148 at the end of fiscal 2024, according to the Annual Statistical Supplement.
The 2025 change was different in speed. In its April 2026 staffing report, SSA listed 56,645 full-time permanent employees for fiscal 2024 and 50,801 for fiscal 2025, a one-year decline of 5,844, or 10.3%. The report's 2024 value differs from the Statistical Supplement's 57,148 because the publications were produced at different times and use slightly different reporting boundaries. Either series shows a drop much larger than any annual decrease in the 1995–2024 supplement.
The latest 48,430 count is an April 2026 snapshot, not a completed fiscal-year observation. It shows that downsizing continued after fiscal 2025, but is not spliced into the annual line.
The beneficiary side moved almost continuously upward. Retired workers and their dependents grew from 31.76 million in 2000 to 56.44 million in 2025. Survivors declined from 6.99 million to 5.85 million, and disabled workers and their dependents rose through the early 2010s before falling to 8.16 million in 2025. Adding Supplemental Security Income recipients to this total would mix different program definitions, so they are excluded from the ratio.
Even this denominator understates the variety of SSA's work. Employees issue and replace Social Security cards, maintain earnings records, process Medicare-related actions, conduct continuing disability reviews, resolve overpayments, answer calls, staff field offices and adjudicate appeals. The ratio is best read as beneficiary exposure per worker, not as completed transactions per worker.
Where did the recent losses land?
FederalHiringData's local OPM Federal Workforce Data warehouse provides a separate monthly view. It counts a somewhat broader covered SSA workforce than the annual full-time permanent series. In that measure, employment fell from 57,952 in December 2024 to 49,439 in June 2026, a loss of 8,513 workers, or 14.7%.
The personnel flows were lopsided. OPM recorded 9,126 SSA separations and 1,013 accessions from January 2025 through June 2026. Calendar 2025 alone had 7,802 separations and just 90 accessions. Entry began to recover in spring 2026: the first six months recorded 923 accessions, including more than 300 in both May and June. That is a meaningful turn, but it had not replaced the earlier losses.
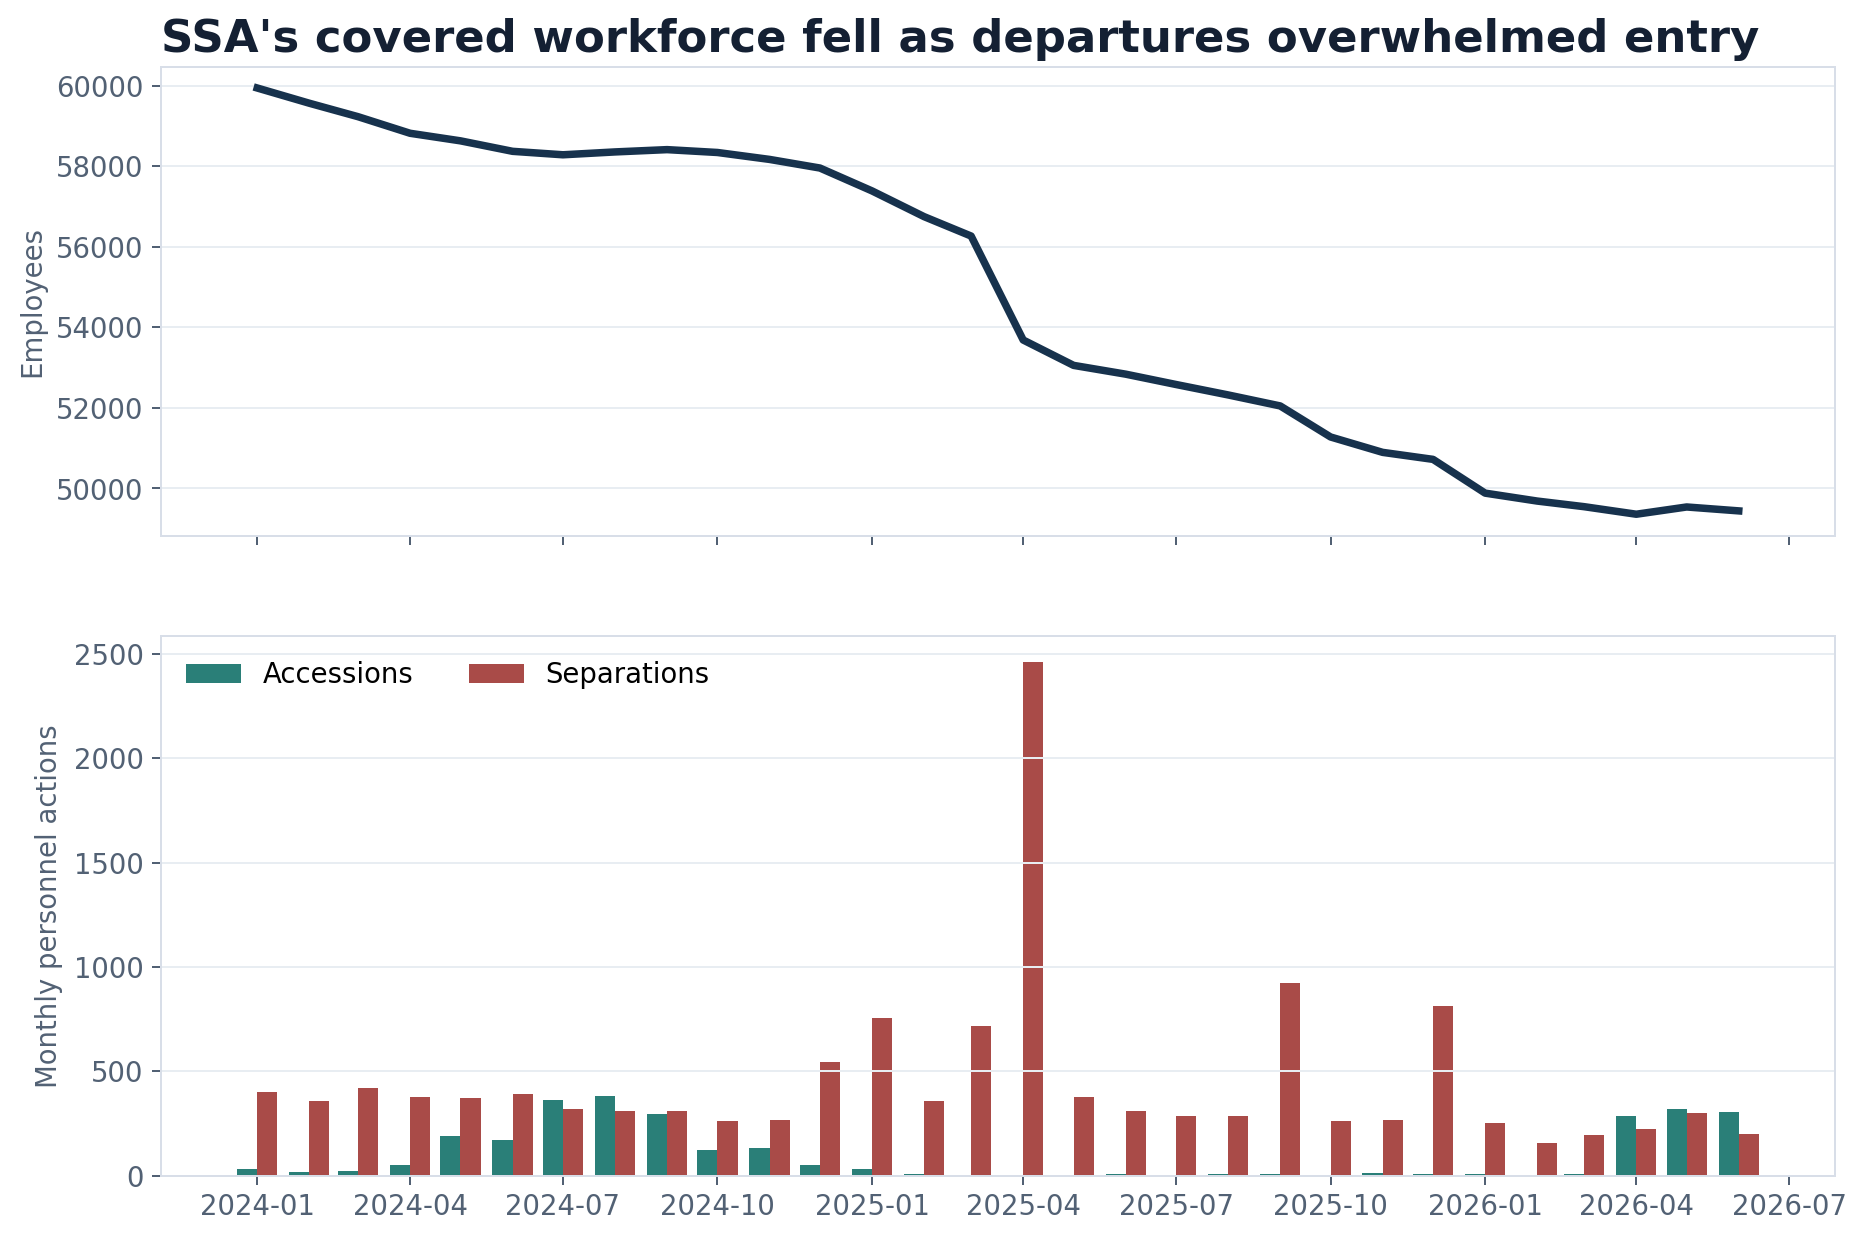
Recorded personnel actions also show how much experience departed. Multiplying each separation count by its reported length of federal service yields about 192,918 years of service associated with the 9,126 exits. Some 5,031 of those separations involved employees with at least 20 years. This does not mean all knowledge was permanently lost, or that every exit resulted from the same policy. It does establish the depth of the departing cohort.
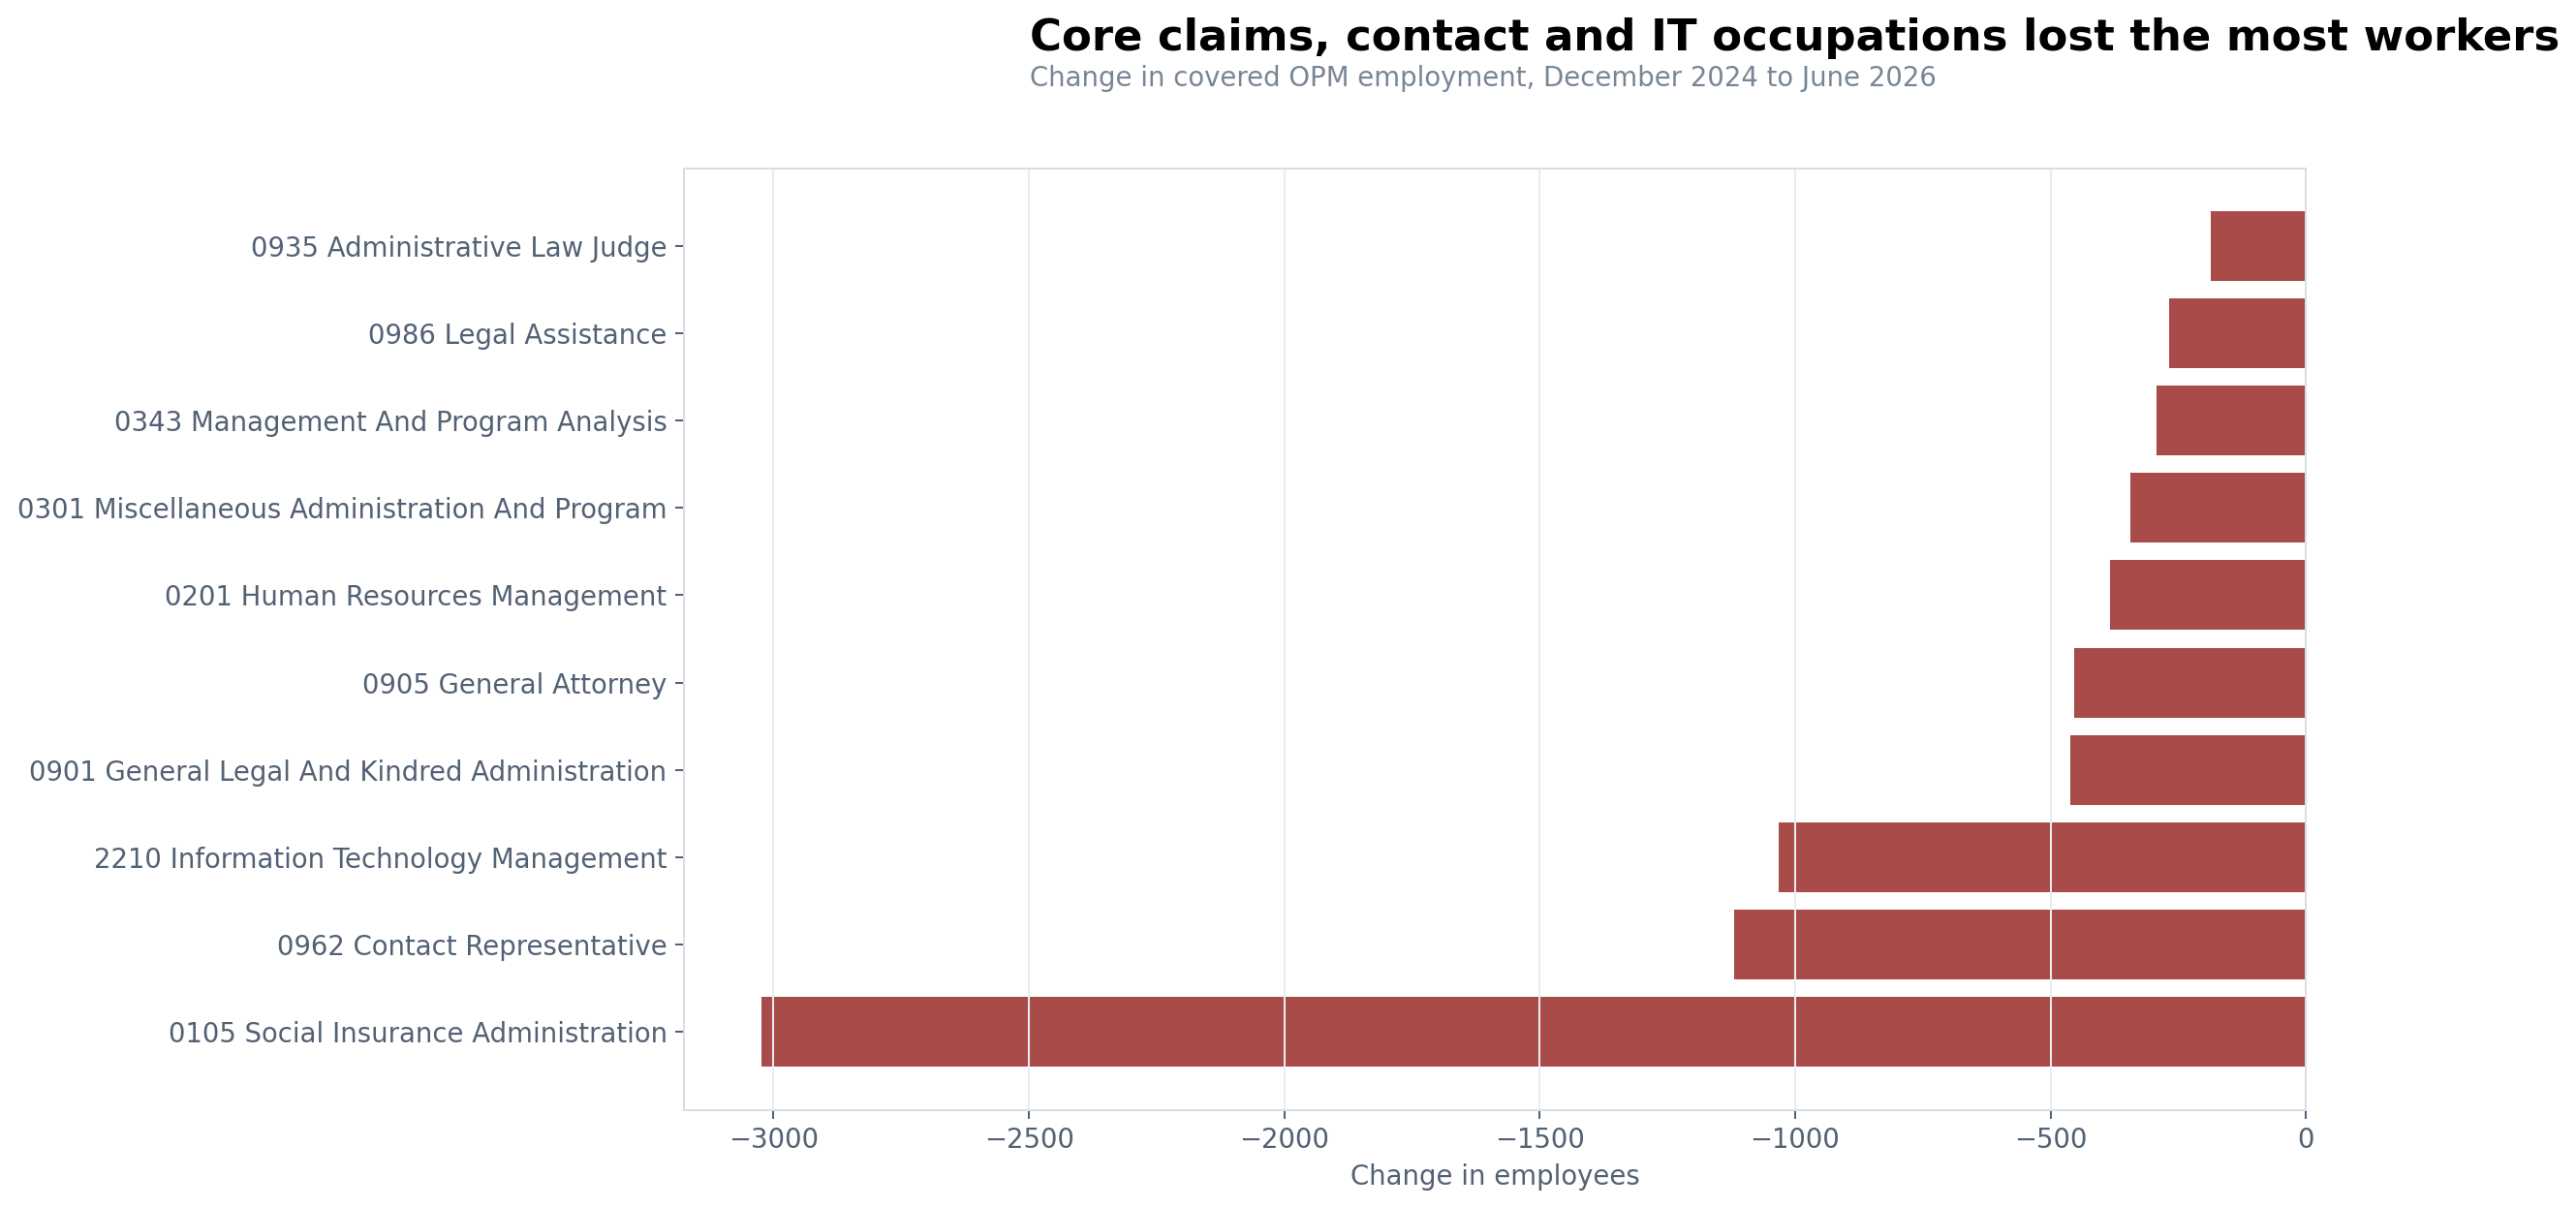
The largest occupational losses were directly connected to claims and public contact. Social insurance administration, the 0105 series that includes much of SSA's claims work, fell by 3,024 employees. Contact representatives fell by 1,120. Information technology management fell by 1,033. Legal administration, attorneys, program analysts and administrative law judges also declined.
| Occupational series | Dec. 2024 | June 2026 | Change |
|---|---|---|---|
| 0105 Social insurance administration | 27,068 | 24,044 | -3,024 |
| 0962 Contact representative | 9,716 | 8,596 | -1,120 |
| 2210 Information technology management | 3,962 | 2,929 | -1,033 |
| 0901 Legal and kindred administration | 3,535 | 3,074 | -461 |
| 0905 Attorney | 3,204 | 2,751 | -453 |
| 0201 Human resources management | 809 | 425 | -384 |
| 0343 Management and program analysis | 2,162 | 1,870 | -292 |
| 0935 Administrative law judge | 1,139 | 952 | -187 |
The contraction was geographically broad. Maryland, home to SSA headquarters, had 8,124 covered employees in June 2026, down 1,600 from December 2024. California fell by 683, Pennsylvania by 562, Illinois by 468, Texas by 451 and New York by 436. These duty stations do not measure each state's field-office staffing because headquarters and processing-center employees serve national workloads.
Did service get worse?
The long-run service record does not support the idea that technology made staffing irrelevant. Initial disability processing averaged 120 days in fiscal 2019. It reached 218 days in 2023 and 231 in 2024 before easing to 226 in 2025. The pending initial-disability workload nearly doubled from 593,944 in 2019 to 1.18 million in 2024, then fell to 885,180 in 2025.
National 800-number answer time followed a different path but reached the same period of strain. It improved from 20.4 minutes in 2019 to 13.5 in 2021, then deteriorated to 32.7 in 2022 and 35.8 in 2023. It recovered to 27.6 minutes in 2024 and 15 in 2025. Those figures come from SSA's FY2023–FY2025 and FY2025–FY2027 performance reports.
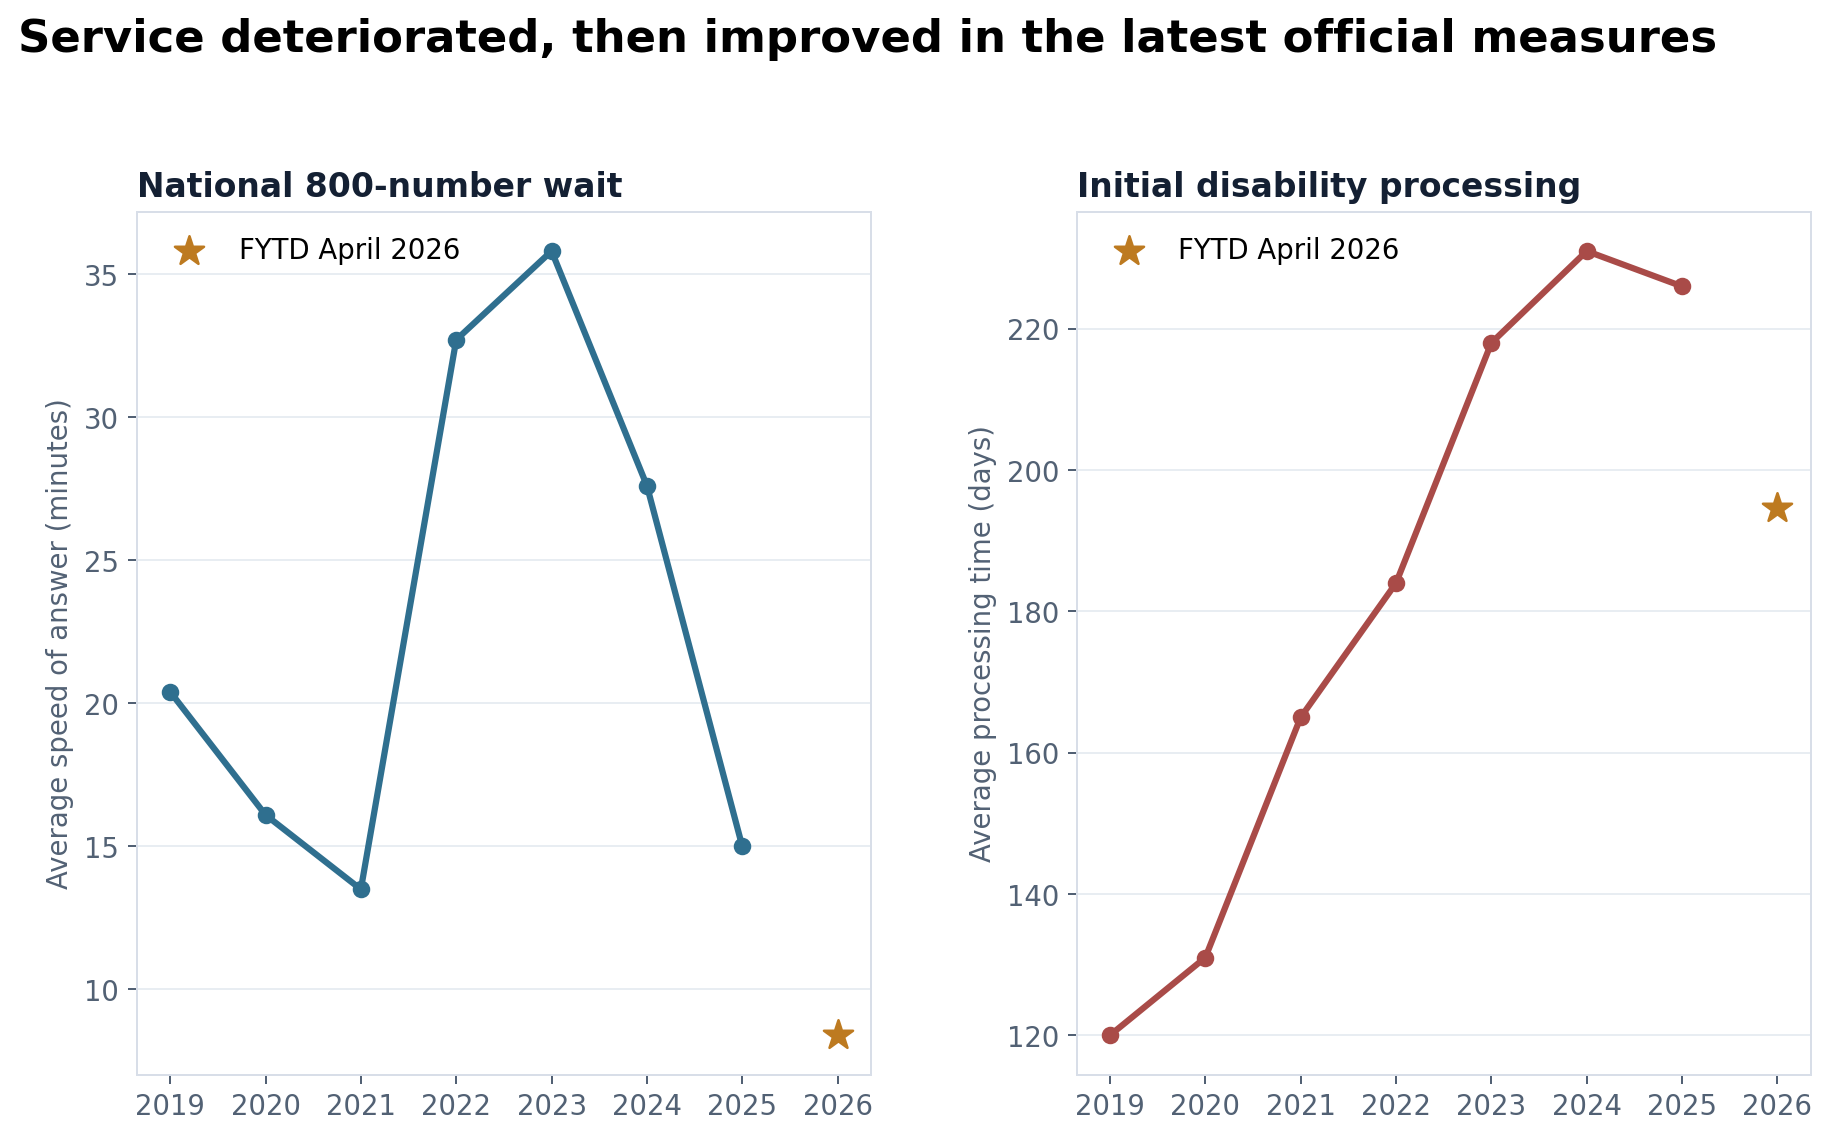
The newest comparable figures are stronger than the annual history might suggest. For the October-through-April periods in fiscal 2024 and 2026, the national phone answer time fell from 34.0 minutes to 8.4. The answer rate rose from 54.7% to 75%. Field-office visitor wait fell from 29.7 minutes to 20.8. Initial disability processing fell from 229.5 days to 194.7, and pending initial claims fell from 1.25 million to 852,875.
| Service measure, October–April | FY2024 | FY2026 | Change |
|---|---|---|---|
| National 800-number answer time | 34.0 min. | 8.4 min. | -75.3% |
| National 800-number answer rate | 54.7% | 75.0% | +20.3 points |
| Field-office visitor wait | 29.7 min. | 20.8 min. | -30.0% |
| Initial disability processing | 229.5 days | 194.7 days | -15.2% |
| Initial disability claims pending | 1,246,050 | 852,875 | -31.6% |
| Online transactions completed | 280,960,681 | 385,227,116 | +37.1% |
These are agency-reported results, and they do not prove that every office or claimant experienced the average. SSA also warns that a new phone platform makes one field-office call measure incomparable with prior years. But the national 800-number, visitor and disability comparisons are too large to dismiss. Recent staffing losses coincided with better measured performance, not a systemwide collapse.
How much did digital service change the equation?
Online scale helps explain the improvement. Completed online transactions rose from 281.0 million in the first seven months of fiscal 2024 to 385.2 million in the same period of 2026. The number of personal my Social Security accounts reached 101.5 million, up from 83.8 million. Total contacts across offices, telephone and online channels increased from 381.3 million to 482.5 million.
That is evidence for the productivity case. Better self-service, call routing, appointment use and automated processing can handle more interactions without matching beneficiary growth worker for worker. SSA says its upgraded phone system can complete some calls without an agent, and its current performance page reports continued gains through May 2026.
Digital demand did not simply replace human demand. The first seven months of fiscal 2026 still brought 48.3 million calls to the national number and 16.9 million field-office visitors. Agents served 22.9 million national-line customers. Difficult claims, identity issues, payment problems and appeals remain labor-intensive.
The physical network is also carrying more people. SSA reported 1,340 field offices in 2000 and 1,231 in 2024. Beneficiaries per field office therefore rose from about 33,900 to 55,600, a 64% increase. That is not a local caseload calculation: beneficiaries can use online and national services, and many never visit an office. It is a measure of how the access network changed as the beneficiary population grew. Field-office staff fell from 25,845 in fiscal 2024 to 22,652 in April 2026.
Can SSA rebuild its replacement pipeline?
SSA announced in February 2025 that it would target a workforce of 50,000, down from roughly 57,000, primarily through retirement, voluntary separation and resignation. It also reduced its regional structure from 10 offices to four and said it would move resources toward direct service. The agency's announcement tied the plan to administration-wide orders; it should not be described as a single DOGE directive.
The remaining workforce became more experienced on average, partly because fewer younger employees remained. Covered employees under age 30 fell from 2,520 in December 2024 to 1,565 in June 2026, a 37.9% reduction. Employees age 60 or older fell by 25.5%, from 8,093 to 6,030. GS-1 through GS-7 employment dropped by 56.2%, from 5,601 to 2,452.
Recruiting records point in the same direction. FederalHiringData's USAJOBS archive contains 3,081 distinct SSA announcements opened in 2024, but only 106 in 2025 and 79 from January through August 14, 2026. Announcements reporting a starting grade from GS-1 through GS-7 fell from 415 in 2024 to 12 in 2025, with 17 in partial 2026.
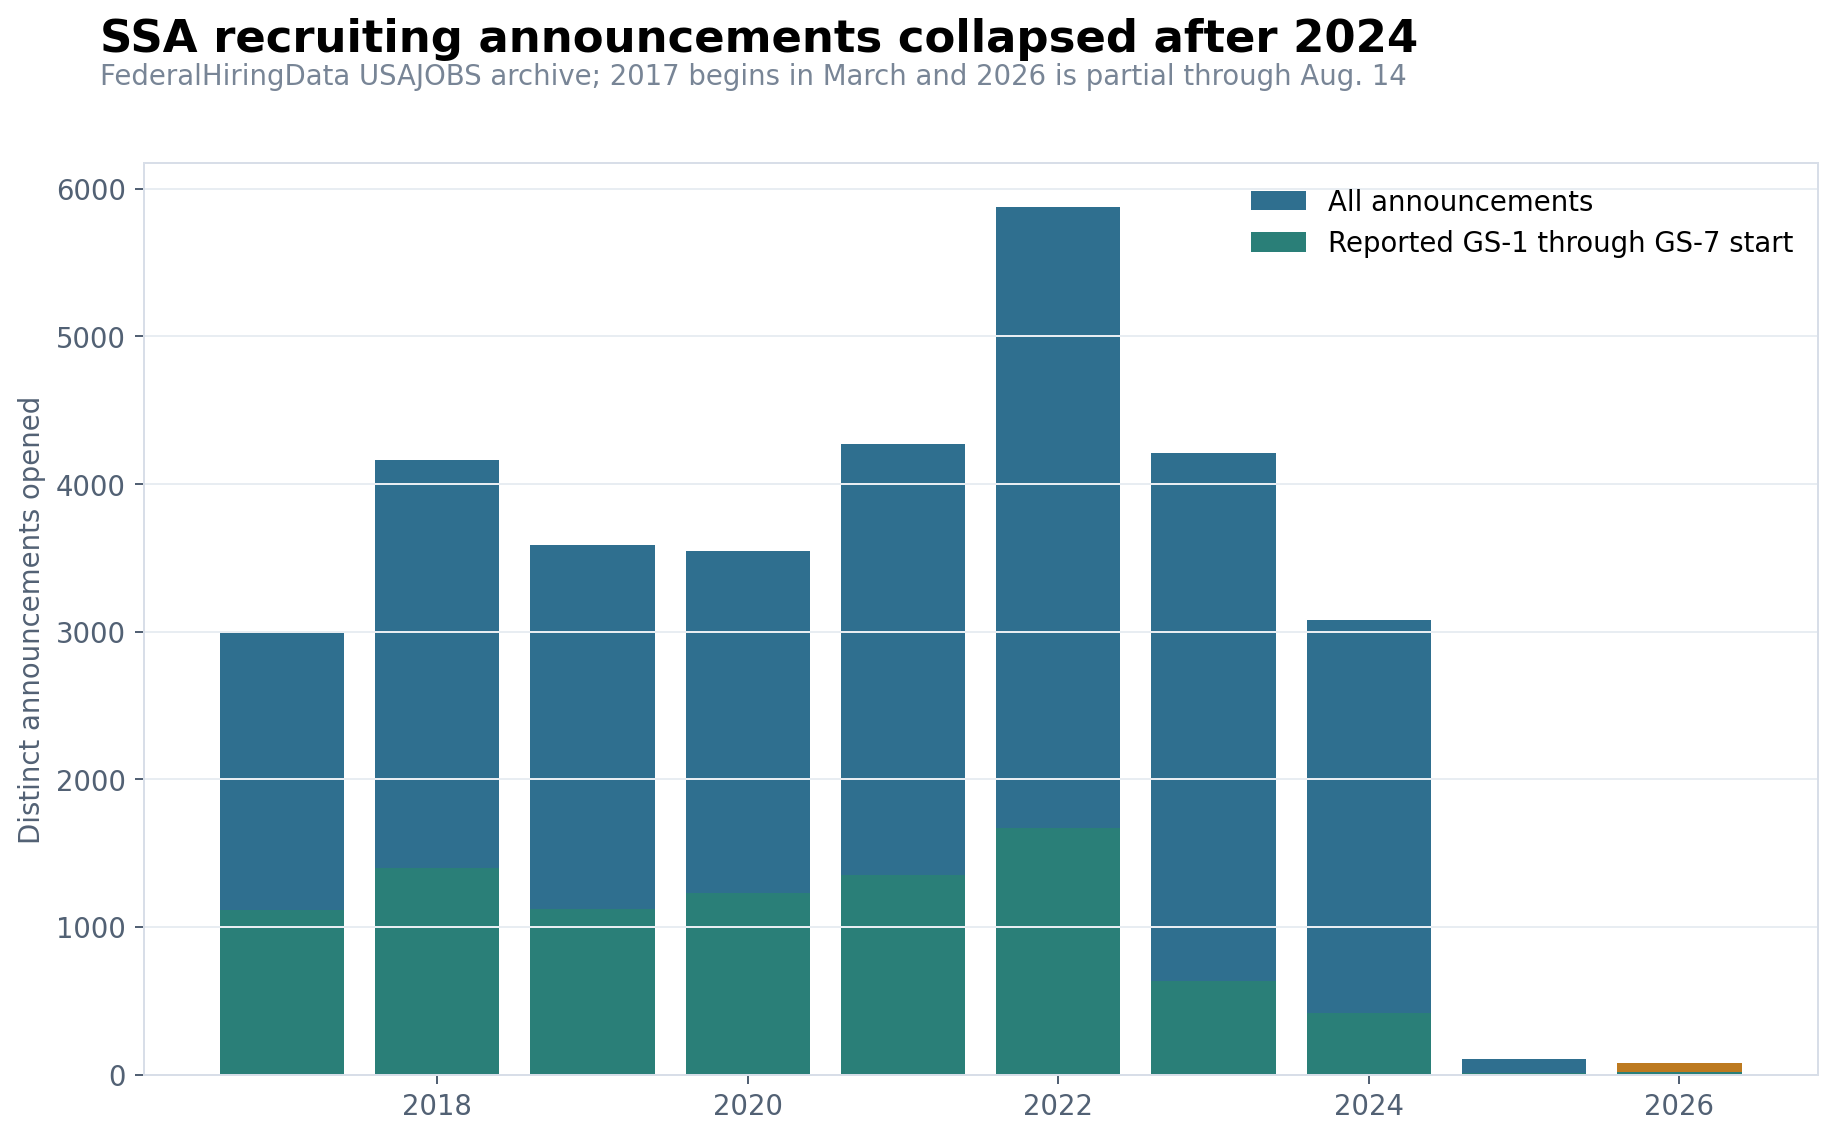
Announcements are not hires, and one announcement can advertise one vacancy, many vacancies or a standing register. The archive begins in March 2017. The result nevertheless shows how little public recruiting was visible during the period of heavy separation. GAO concluded in January 2026 that SSA needed a plan to maintain the skills required for timely service, identifying hiring restrictions and recruitment challenges as risks.
There are signs of a controlled rebuild. OPM accessions accelerated in April, May and June 2026. SSA said it would focus fiscal 2026 hiring on highly skilled IT and field-office work, and it consolidated eight processing centers under a single organization in July. The processing-center reorganization may improve consistency, but it is too new for a durable performance verdict.
Did the smaller workforce save much?
The visible annualized adjusted-basic-pay total in OPM records fell from $5.72 billion in December 2024 to $5.10 billion in June 2026, a nominal decline of about $617 million, or 10.8%. Average visible adjusted basic pay rose 4.7%, from $99,170 to $103,798, as pay schedules and workforce composition changed.
That payroll calculation is not an audited expense total. It excludes benefits, overtime and other compensation, and it does not measure transition costs or the value of delayed work. It does show why headcount reduction can lower salary commitment even when average pay rises.
SSA is already inexpensive relative to the benefits it administers. Its actuarial administrative-cost series puts OASDI administrative expenses at 0.5% of benefit payments in 2024 and 0.4% in 2025. That comparison covers OASDI trust-fund administration, not every cost SSA incurs for SSI, Medicare-related work or other responsibilities. It provides scale: even large workforce reductions make a small change beside the value of benefits, while a service delay can matter greatly to the person waiting for income.
Under the intermediate assumptions in the 2026 Trustees Report, OASDI beneficiaries rise to about 76.9 million in 2030. That projection uses a slightly different definition from this article's year-end series, so no falsely precise ratio is attached. At staffing near 50,800, however, exposure would exceed 1,500 beneficiaries per worker.
The latest service recovery shows that headcount is not destiny. Technology, work design and management can change how much an employee can accomplish. It also raises the standard for judging the restructuring. A few good quarters are evidence of progress; they are not proof that an agency with 192,918 years of recently departed experience, a sharply smaller entry pipeline and a rising beneficiary population has found a lasting equilibrium.
Methodology and limitations
FederalHiringData calculated the long-run ratio using SSA's year-end OASDI beneficiary counts and full-time permanent staff on duty at the end of each fiscal year. The comparable annual staff series comes from SSA's Statistical Supplement for 1995–2024; the 2025 value comes from the April 2026 staffing report. The reports' 2024 values differ, so the source change is disclosed rather than silently blended. No matched 2026 ratio is reported because a 2026 year-end beneficiary count is not available.
Recent workforce, occupation, age, grade, location, accession, separation, tenure and pay calculations use monthly OPM Federal Workforce Data stored in FederalHiringData's read-only research warehouse. OPM's covered monthly count is kept separate from SSA's full-time permanent series. USAJOBS results use 31,922 archived SSA announcements opened from March 2017 through August 14, 2026. Announcements do not equal vacancies or hires.
Service measures come from SSA performance reports and its April 2026 Operations 360-View. Fiscal-year-to-date values cover October through April. Field-office counts come from SSA Statistical Supplements. The hero shows a Social Security Board records worker in Baltimore between 1937 and 1939; Harris & Ewing photograph, Library of Congress, no known restrictions on publication.
Explore current Social Security Administration jobs, the federal workforce statistics, agency profiles and more FederalHiringData investigations.
Keep reading
Related federal hiring research
Article data window: FY2019-FY2025
Contract Spending and Federal Headcount Often Moved Independently
Across a bounded 28-agency sample, contract-obligation growth and covered headcount growth had only a 0.169 correlation; five agencies increased obligations while headcount fell.
Article data window: Jan. 1-14, 2026
Federal Healthcare Hiring Led Early January 2026 Job Announcements
Veterans Health Administration, nurse roles, medical officers, and other clinical and support occupations drove the strongest healthcare signal in the early January archive.
Article data window: Jan. 1-14, 2026
Federal Hiring Trends: Jan. 1-7 vs Jan. 8-14, 2026
Veterans Health Administration stayed dominant, nurse and medical roles strengthened, and remote-work signals remained too sparse for a public trend claim.
Federal Hiring Data Weekly
Subscribe to Federal Hiring Data Weekly.
Subscribe to Federal Hiring Data Weekly. Confirm your email after signing up to receive federal hiring trends, salary data, agency movements, and original research.