August 18, 2026
TSP Loan and Hardship-Withdrawal Use Rose in 2025
TSP loan use reached 9.5% of active FERS participants and hardship-withdrawal use reached 4.9%, even as participation, deferrals and account balances also increased.
Published August 18, 2026Last edited August 18, 2026

The share of active Federal Employees Retirement System participants using Thrift Savings Plan loans rose to 9.5% in 2025, while the share using financial-hardship withdrawals reached 4.9%, according to the Federal Retirement Thrift Investment Board's latest annual report.
Both were the highest rates in the five-year series presented in the report. Loan use was 8.5% in 2024; hardship-withdrawal use was 3.8%.
The increase deserves attention, but it is not a diagnosis of federal employees' finances. A TSP loan is repaid to the participant's account, and aggregate usage rates do not reveal why a participant borrowed, how much was borrowed, or whether the decision created financial difficulty. A hardship withdrawal has different rules and consequences, but the public annual tables still do not measure an individual's financial condition.
FederalHiringData structured the report's participant, contribution, balance, loan and withdrawal tables to separate those facts from interpretation.
Loan and hardship-withdrawal use increased together
| Active FERS participant measure | 2021 | 2022 | 2023 | 2024 | 2025 |
|---|---|---|---|---|---|
| Used a TSP loan | 7.0% | 6.6% | 8.3% | 8.5% | 9.5% |
| Used a hardship withdrawal | 4.0% | 2.1% | 3.1% | 3.8% | 4.9% |
| Participation rate | 95.5% | 95.1% | 95.9% | 95.9% | 96.2% |
| Average deferral rate | 8.4% | 8.9% | 9.1% | 9.2% | 9.3% |
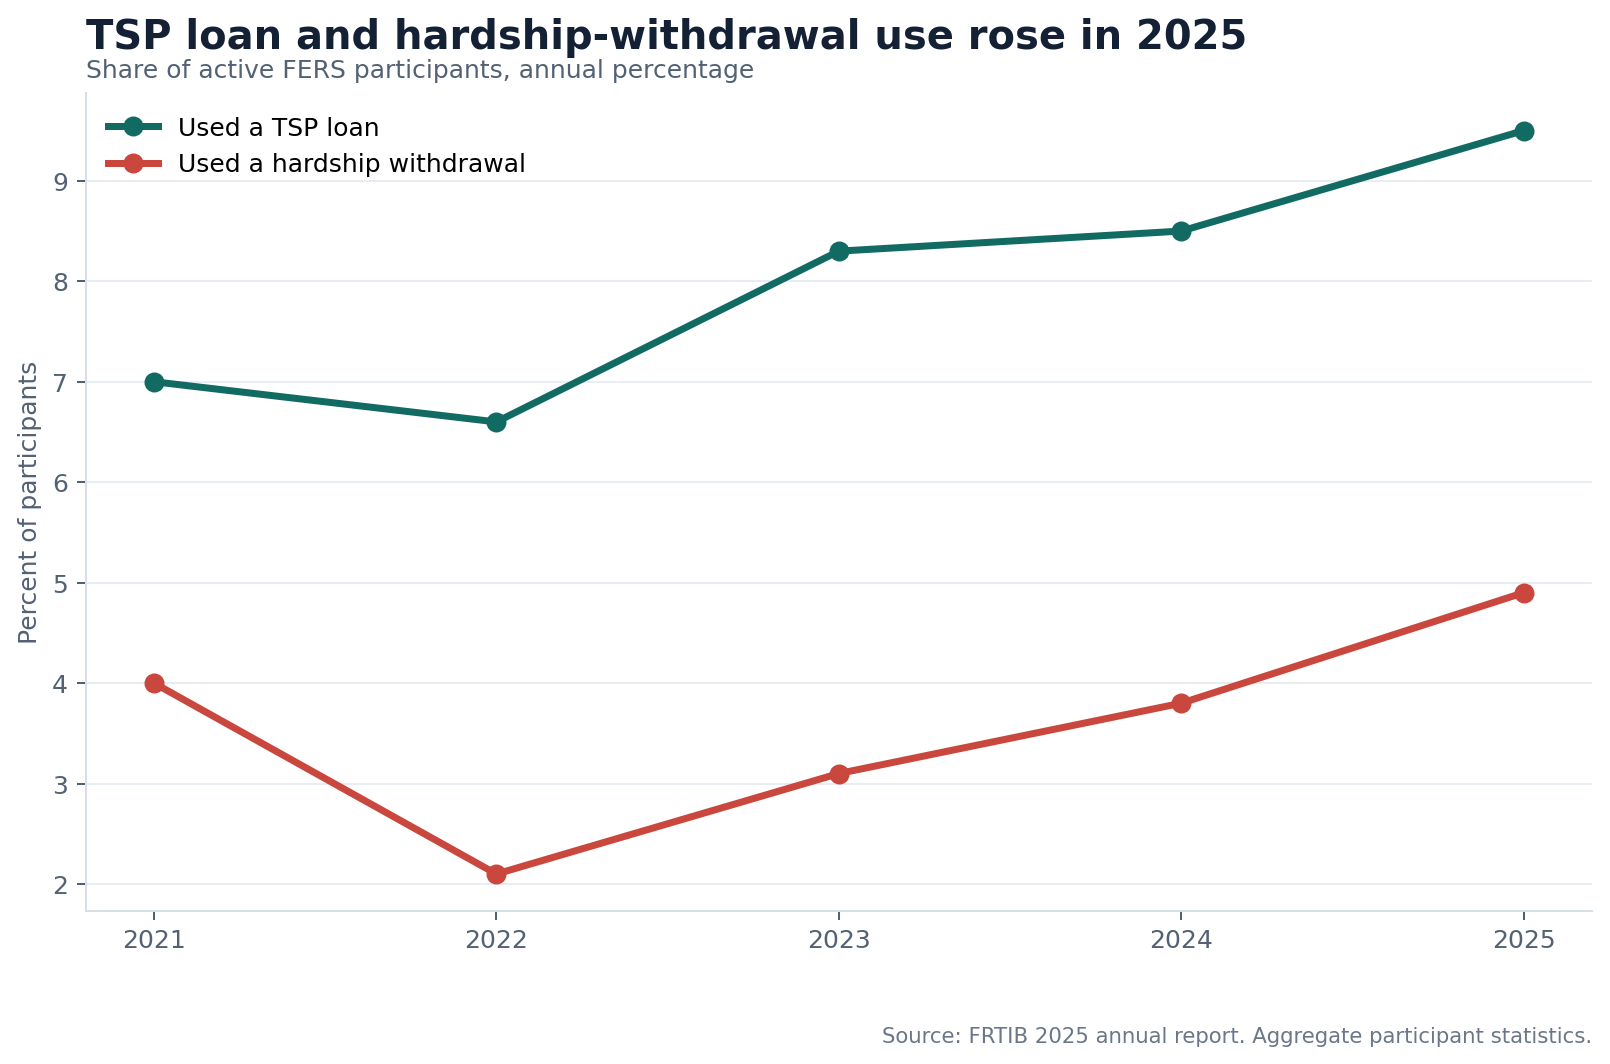
The 2025 increase was one percentage point for loans and 1.1 percentage points for hardship withdrawals. Relative to the prior year's rates, that was an 11.8% increase in the loan-usage rate and a 28.9% increase in the hardship-withdrawal rate.
Those relative changes can sound larger than the underlying movement. The clearest description is the percentage-point change: from 8.5% to 9.5% for loans and from 3.8% to 4.9% for hardship withdrawals.
The same report shows that retirement-plan participation and average employee deferrals also edged upward. That mixed picture is one reason not to reduce the data to a claim that participants were universally under more financial stress.
More than 4.1 million active FERS participants had balances
FRTIB reported 4,142,688 active FERS participants with a TSP balance in 2025, up from 4,040,896 in 2024. Of the 2025 participants, 1,129,246 had a Roth balance.
| Balance measure | 2024 | 2025 | Change |
|---|---|---|---|
| Participants with a balance | 4,040,896 | 4,142,688 | +101,792 |
| Participants with a Roth balance | 1,060,991 | 1,129,246 | +68,255 |
| Average total balance | $194,131 | $217,291 | +11.9% |
| Median total balance | $61,817 | $71,815 | +16.2% |
| Average Roth balance | $31,258 | $37,382 | +19.6% |
| Median Roth balance | $10,854 | $12,997 | +19.7% |
The average total balance was more than three times the median. That gap is expected in a distribution where a smaller number of long-tenured or high-balance participants pull the average upward. The median better describes the midpoint participant, while the average is useful for measuring aggregate account values.
Neither figure is an investment-return measure by itself. Balances change with contributions, withdrawals, loans, repayments, market performance, participant age, salary and length of service. Comparing the 2024 and 2025 balances does not isolate any one factor.
Participation remained high across most age groups
FRTIB's active-FERS participation rate reached 96.2% in 2025. The report's demographic table shows relatively small differences among participants below age 70.
| Age group | 2025 participation rate | 2025 average deferral rate |
|---|---|---|
| 29 or younger | 96.6% | 7.9% |
| 30-39 | 96.8% | 8.0% |
| 40-49 | 96.8% | 8.5% |
| 50-59 | 96.1% | 10.0% |
| 60-69 | 94.4% | 10.8% |
| 70 or older | 89.8% | 10.3% |
Participation was highest for the 30-39 and 40-49 groups. Average employee deferrals generally increased with age through the 60-69 group.
That pattern is descriptive, not advice about how much any person should contribute. Older participants may have higher earnings, fewer competing expenses, more awareness of retirement needs or access to catch-up contributions. The annual aggregate tables do not identify the reason.
Pay groups showed a wider deferral gap
FRTIB also publishes salary-quintile comparisons. The lowest-paid fifth of active FERS participants had a 93.8% participation rate and a 7.4% average deferral rate in 2025. The highest-paid fifth had a 98.3% participation rate and a 10.8% average deferral rate.
| FRTIB salary group | Participation | Average deferral |
|---|---|---|
| Q1, lowest paid | 93.8% | 7.4% |
| Q2, lower paid | 95.4% | 8.4% |
| Q3, middle | 96.1% | 9.4% |
| Q4, higher paid | 97.4% | 10.4% |
| Q5, highest paid | 98.3% | 10.8% |
The 3.4-percentage-point participation gap was smaller than the 3.4-point deferral-rate gap in percentage terms because participation was already high across all five groups.
FRTIB estimates salary for this analysis using the employing agency's automatic 1% contribution. That method is important: these are not payroll-record salary bands supplied directly in the public table, and the quintile boundaries are relative to the active-FERS population.
Traditional and Roth deferral rates were almost unchanged
The overall average employee deferral rate rose from 9.2% in 2024 to 9.3% in 2025. Within the report's tax-treatment measures, the traditional deferral rate edged down from 7.7% to 7.6%, while the Roth deferral rate edged down from 7.1% to 7.0%.
Those figures are not intended to add to the 9.3% overall rate. Participants can use both traditional and Roth contributions, and the report presents the measures for their respective participant groups.
The number of participants with Roth balances grew 6.4% in 2025, faster than the 2.5% growth in all participants with balances. That says Roth accounts became more common in the active-FERS population. It does not establish that Roth was the better choice for any individual participant.
What the increase in borrowing can mean, and what it cannot
The rise in loan and hardship-withdrawal use is a legitimate research signal because both measures moved upward and reached five-year highs in the official table.
Several explanations could be consistent with that result. The participant population grew. Borrowing rules and participant awareness can change. Household expenses, interest rates, emergencies and access to other credit can affect decisions. The public report does not attribute the increase to one cause.
A TSP loan is also structurally different from a commercial loan. Participants borrow from their own accounts and repay principal and interest back to those accounts, subject to plan rules. The opportunity cost can include missed market growth, and an unpaid loan can have tax consequences, but usage alone is not evidence of distress.
Financial-hardship withdrawals are a more direct signal that participants certified an immediate and significant financial need under plan rules. Even there, the aggregate rate does not disclose the size, purpose or longer-term effect of a withdrawal.
The defensible finding is simple: a larger share of active FERS participants used both mechanisms in 2025, even as participation, deferrals and reported balances also increased.
What federal employees can take from the report
For employees, the annual figures are useful benchmarks rather than prescriptions. A 96.2% participation rate shows that TSP participation is nearly universal among the active FERS group analyzed by FRTIB. It does not say that every participant contributes enough for a particular retirement goal.
The average deferral rate of 9.3% excludes agency contributions. A participant's total savings rate can therefore be higher. Individual circumstances, matching eligibility, retirement system, tax situation and time horizon matter.
Employees considering a loan or withdrawal should rely on current plan rules and their own financial circumstances, not aggregate behavior. The official TSP website explains loan, withdrawal and contribution rules. FederalHiringData is reporting the data, not providing individualized financial advice.
Methodology and limitations
FederalHiringData downloaded the official FRTIB TSP annual reports and extracted native PDF text. The structured dataset records report year, metric year, metric name, demographic dimension, value, unit, table title, page, definition, source file and SHA-256 fingerprint.
The five-year loan, hardship, participation and deferral series comes from the 2025 report's "Highlights at a Glance." Participant and balance totals come from the plan-participation section. Age and salary-quintile values come from the annual FERS demographic tables. The 2024 report was retained as a second source for balance-total validation.
The population is active FERS participants as defined by FRTIB. It is not all federal employees, all uniformed-service members, separated participants, beneficiaries or every TSP account. The analysis does not estimate dollars borrowed or withdrawn because those totals were not used in the extracted table.
Percentage changes are FederalHiringData calculations from published rates. No individual-level records were used. The analysis does not infer financial distress, causation or investment performance from aggregate participation behavior.
Primary sources: the FRTIB 2025 TSP Annual Report, the FRTIB reading room, and the official TSP site. Related FederalHiringData pages: federal workforce statistics, current federal jobs, and research articles.
Hero photo: Cht Gsml on Unsplash, used under the Unsplash License.
Keep reading
Related federal hiring research
Article data window: FY2019-FY2025
Contract Spending and Federal Headcount Often Moved Independently
Across a bounded 28-agency sample, contract-obligation growth and covered headcount growth had only a 0.169 correlation; five agencies increased obligations while headcount fell.
Article data window: Jan. 1-14, 2026
Federal Healthcare Hiring Led Early January 2026 Job Announcements
Veterans Health Administration, nurse roles, medical officers, and other clinical and support occupations drove the strongest healthcare signal in the early January archive.
Article data window: Jan. 1-14, 2026
Federal Hiring Trends: Jan. 1-7 vs Jan. 8-14, 2026
Veterans Health Administration stayed dominant, nurse and medical roles strengthened, and remote-work signals remained too sparse for a public trend claim.
Federal Hiring Data Weekly
Subscribe to Federal Hiring Data Weekly.
Subscribe to Federal Hiring Data Weekly. Confirm your email after signing up to receive federal hiring trends, salary data, agency movements, and original research.