August 24, 2026
NOAA Lost 2,630 Employees. Its Technical Workforce Was Still Thinner in June 2026.
NOAA's covered workforce fell 21.1% from December 2024 through June 2026, with broad losses across science and technical occupations and only selective rebuilding.
By Evan Mercer
Published August 24, 2026Last edited August 24, 2026
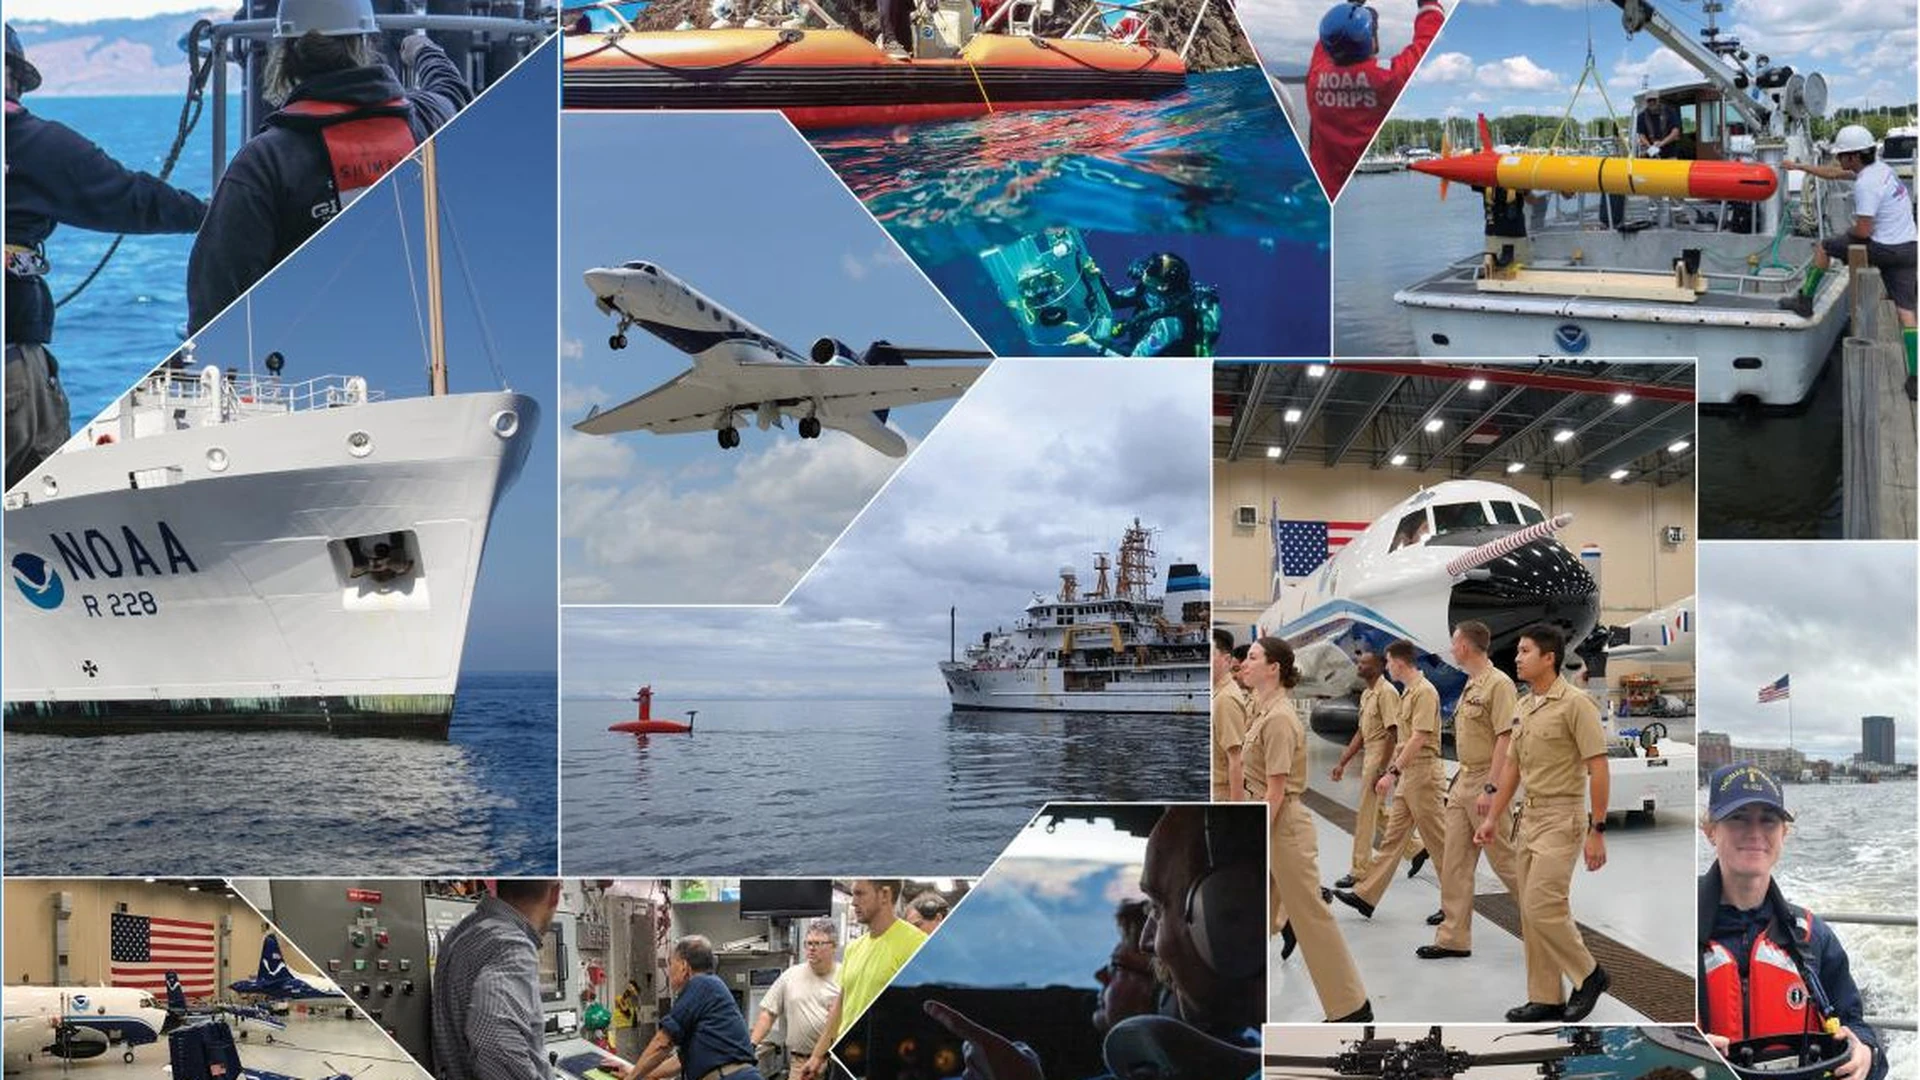
The National Oceanic and Atmospheric Administration ended June 2026 with 9,811 covered employees in public Office of Personnel Management data. That was 2,630 fewer than the agency had at the end of 2024, a decline of 21.1% in 18 months.
The contraction reached well beyond weather forecasting. Information technology, physical science, fish biology, natural-resources management, oceanography, engineering and electronics occupations were all smaller in June 2026 than in January 2025. Meteorology remained NOAA's largest technical occupation in the public file, but it, too, was down by 219 employees.
There were signs of selective rebuilding. OPM recorded more meteorology and hydrology accessions than separations during the first half of 2026. NOAA also continued hurricane field research, satellite operations, fisheries assessments and work aboard its ships and aircraft. Headcount alone cannot establish that a forecast failed, a survey was missed or a satellite went unattended.
What the record does establish is a broad loss of federal capacity entering 2026, concentrated especially among employees with less federal service and among conditional, probationary or trial appointments. The unresolved accountability question is not whether NOAA still performed its mission. It is which offices and shifts absorbed the work after an agency-wide contraction that public personnel data cannot allocate among NOAA's line offices.
A one-fifth contraction extended into 2026
The Government Accountability Office counted 12,441 NOAA employees on Dec. 31, 2024 and 9,984 one year later. It reported 2,526 separations during 2025 and calculated a 22.5% separation rate using the average of the agency's beginning- and end-of-year populations.
FederalHiringData independently reconstructed NOAA's longer workforce series from OPM's legacy FedScope files and current Federal Workforce Data. The public files reproduce the two GAO year-end headcounts and extend the record through June 2026, when the covered total stood at 9,811. That was another 173 below December 2025.
The long view matters. NOAA had 12,463 covered employees in September 2000 and reached 13,040 in September 2010. Headcount later fell to 11,663 in September 2014, then returned to 12,434 by September 2024. The 2025 drop was therefore not simply the continuation of a steady multidecade decline. It followed a period in which the agency had rebuilt toward its earlier size.

The 2,630-person change compares December 2024 with June 2026 because those are exact observations in the current monthly file. Earlier points use September snapshots, the annual month available consistently across the historical series. The chart does not interpolate the missing months or convert budgeted full-time equivalents into onboard employees.
OPM's current-version personnel-action files provide a second view, but their totals should not be substituted for GAO's. Those files record 233 accessions and 2,675 separations in calendar 2025, a net of negative 2,442 actions. GAO reported 2,526 separations. Source revisions, action definitions and the timing of extracts can produce different totals, so this article keeps the two measures separate.
The losses crossed technical occupations
NOAA's public OPM agency code does not divide current employees among the National Weather Service, National Marine Fisheries Service, National Environmental Satellite, Data and Information Service, Oceanic and Atmospheric Research, National Ocean Service, or the Office of Marine and Aviation Operations. It does, however, allow an occupation-level view of NOAA as a whole.
We selected ten occupations closely connected to the agency's science, data, engineering and operational work. Nine were smaller in June 2026 than in January 2025. The largest numerical declines were in information technology, meteorology, natural resources and biology, and physical science.
| Selected occupation | January 2025 | June 2026 | Change | Percent change |
|---|---|---|---|---|
| Meteorology | 2,377 | 2,158 | -219 | -9.2% |
| Physical science | 1,051 | 847 | -204 | -19.4% |
| Information technology | 1,038 | 769 | -269 | -25.9% |
| Natural resources and biology | 853 | 639 | -214 | -25.1% |
| Fish biology | 758 | 594 | -164 | -21.6% |
| Electronics technical | 419 | 365 | -54 | -12.9% |
| Hydrology | 260 | 232 | -28 | -10.8% |
| General engineering | 174 | 141 | -33 | -19.0% |
| Oceanography | 158 | 123 | -35 | -22.2% |
| Meteorological technician | 143 | 99 | -44 | -30.8% |

These ten series are a transparent selection, not a complete definition of NOAA's technical workforce. The agency also employs program managers, budget analysts, contracting specialists, administrators, vessel crews and other workers whose contributions cannot be reduced to a science-series code. Contractors, grantees, cooperative-institute researchers and members of the uniformed NOAA Corps are not added to the civil-service counts.
Even with those limits, the distribution is revealing. The decline was not confined to one weather office or one occupational specialty. IT fell by 269 employees, or 25.9%. Natural-resources and biology positions fell by 214, or 25.1%, while fish biology fell by 164, or 21.6%. Physical science fell by 204, or 19.4%. The smaller meteorological-technician series recorded the largest percentage decline in the selection, 30.8%.
The data cannot show which projects lost those employees. An oceanographer assigned to coastal modeling, a physical scientist working with satellite observations and an IT specialist supporting a forecast system all appear at the same agency-wide level. Claims about a particular hurricane model, fishery survey or satellite program would require assignment data that OPM does not publish.
The early-career pipeline narrowed fastest
GAO found a sharper separation rate among NOAA employees in probationary or trial periods. The agency began January 2025 with 2,261 people in that category and ended the year with 1,039. GAO counted 632 separations and calculated a 38.3% separation rate, compared with 22.5% for NOAA employees overall.
That category needs careful interpretation. GAO said the data could not distinguish newly hired employees serving an initial probation from existing employees serving a trial period after moving into supervision or management. It therefore does not measure entry-level workers alone.
OPM publishes a related but broader tenure group covering career-conditional and other conditional, probationary or trial appointments. That group fell from 2,327 employees in January 2025 to 1,015 in June 2026, a decline of 1,312, or 56.4%. Because the definitions differ, the OPM count is shown alongside GAO's rates rather than presented as the same population.

Length-of-service data point in the same direction. NOAA employees with less than five years of federal service fell from 3,287 in January 2025 to 1,166 in June 2026, a reduction of 2,121, or 64.5%. Employees with at least 20 years of service also declined, from 4,168 to 3,500, but their share of the smaller agency rose from 33.6% to 35.7%.
That does not mean NOAA simply became older. Employees age 55 or above fell from 3,668 to 2,709, and their share declined from 29.6% to 27.6%. The more defensible finding is about experience mix: the under-five-year group contracted much faster than the workforce overall, leaving long-tenured employees as a larger share without producing a simple rise in the oldest age group.
This matters for succession because headcount and institutional experience are different resources. A future accession can replace a position numerically before a new employee has learned a specialized instrument, local forecast environment, vessel system or federal program. Public OPM data do not measure that learning curve, so they can identify the pipeline change but not assign a recovery time.
Hiring in 2026 rebuilt only at the margin
The action files show a break from the extraordinary imbalance of 2025. NOAA recorded 248 accessions and 329 separations from January through June 2026, a net of negative 81 actions. That was still a net decline, but far smaller than the current-version file's negative 2,442 action balance in 2025.
Meteorology was the clearest exception. It recorded 87 accessions and 49 separations in the first half of 2026, a positive balance of 38. Hydrology recorded nine accessions and four separations. Those gains help explain why meteorology rose from 2,122 employees in December 2025 to 2,158 in June 2026 and hydrology held at 232.
Most of the other selected occupations still had more separations than accessions. IT recorded one accession and 23 separations; physical science recorded 14 and 35; natural resources and biology recorded none and 21; fish biology recorded two and 14; and electronics technical recorded eight and 15. Personnel actions are events, not necessarily unique people, but the direction shows that rebuilding was selective rather than broad.
Federal Hiring Data Weekly
Get the biggest federal workforce changes in your inbox.
Subscribe to Federal Hiring Data Weekly for federal hiring trends, salary data, agency movements, and original investigations, with email confirmation before delivery.

The historical USAJOBS archive offers a different measure: recruiting notices. It contains 2,498 distinct announcements opened under NOAA, the National Weather Service or National Marine Fisheries Service in 2024, followed by 200 in 2025 and 162 from Jan. 1 through Aug. 13, 2026.
The archive begins on March 2, 2017, and the 2026 period is partial, so those two years are not directly comparable with full calendar years. More importantly, an announcement is not a vacancy, hire or person. One notice can cover multiple locations or positions, be reopened, or serve as a standing register. The collapse after 2024 is nevertheless large enough to show that NOAA's public recruiting activity changed sharply.

Among the 162 archived 2026 announcements, the selected technical occupations included 17 meteorology notices, nine IT notices, nine fish-biology notices, eight physical-science notices, five natural-resources or biology notices, four hydrology notices, four electronics notices and three engineering notices. Those notices show where some hiring continued. They cannot establish how many employees entered or which line office received them.
Readers seeking positions open now should use the current federal jobs search, which is intentionally separate from the historical archive. The occupation directory and agency directory provide current and historical context without treating old announcements as live openings.
A smaller workforce still carried a national operating footprint
NOAA's mission footprint did not shrink into one clean workforce denominator. The National Weather Service has 122 Weather Forecast Offices and described a 100-site upper-air network. As of May 2026, NOAA's satellite office listed 15 satellites owned or operated by the agency. The Office of Marine and Aviation Operations reported 15 research and survey ships and 10 specialized aircraft. NOAA Fisheries completed 173 stock assessments in fiscal 2025.

Those counts describe different units and should not be added together. They show the variety of systems supported by NOAA employees, not a workload-per-worker ratio. A forecast office, satellite, ship, aircraft and fish-stock assessment require different staffing models, contractors and schedules.
Official records do document particular pressure points. In April 2025, the National Weather Service notified users that selected upper-air sites could reduce or suspend weather-balloon launches because of staffing limits or operational priorities. The notice also described alternatives and procedures intended to maintain service continuity across the broader 100-site network.
The Salt Lake City forecast office later reported that its historical twice-daily release timing was restored in August 2026 after scheduling solutions and vacancy advertising. That is evidence of both a staffing-related reduction and a localized recovery. It is not evidence that the entire upper-air network failed.
A 2026 NOAA Science Advisory Board working-group report said reduced staff were taking double or triple responsibilities and that contract and grant execution had experienced major delays. The same report credited dedicated employees with fulfilling the mission and noted that a 2025 AI-enhanced Global Forecast System produced the best track forecasts among the compared models, though intensity forecasts lagged. The working group's assessment is important expert evidence, but it is not a NOAA management finding or an OPM workforce measure.
NOAA's 2026 Hurricane Field Program also continued research and operational support. That continuity is counterevidence to any claim that headcount alone proves degraded hurricane capability. It also sharpens the workforce question: maintaining output during a contraction may reflect prioritization, overtime, reassignment, contractor support or deferred work, none of which can be separated in the public headcount file.
Hurricane science is the context, not an outcome measure
Related research
Put this finding in context

Data investigationsAugust 24, 2026
IRS Had 126 AI Use Cases. Its Technical Workforce Fell 28%.
Most IRS AI use cases were still in development as a selected technical-workforce proxy fell by 2,459 employees from January 2025 through June 2026.

Data investigationsAugust 24, 2026
NSF's Proposal Workload Rose 8%. Its Federal Workforce Fell 36%.
NSF received 43,532 competitive proposals in fiscal 2025 as its covered federal workforce fell by 615 employees from December 2024 through June 2026.
Hurricane work makes NOAA's workforce question unusually visible, but it does not supply a simple performance test. Forecasts draw on observations, numerical models, forecaster judgment, communications and systems maintained across multiple NOAA components. A change in agency headcount cannot be assigned to any one link in that chain without program and shift records.
The agency's 2026 Hurricane Field Program is a useful counterweight to a collapse narrative. NOAA's Atlantic Oceanographic and Meteorological Laboratory described an active program supporting research and operations, while OMAO's aircraft and crews remained part of the observing system. That official record shows continued work. It does not reveal whether teams had the same staffing margin, how much overtime was used, or which proposed research could not be attempted.
The Science Advisory Board working group likewise presented a mixed picture. It described reduced staffing, double or triple responsibilities, and delayed contract and grant execution. Yet it also said dedicated staff had fulfilled the mission and highlighted performance from an AI-enhanced Global Forecast System: its 2025 track forecasts led the compared models, while intensity performance lagged. Strong output in one model does not erase a workforce contraction, just as a workforce contraction does not prove forecasting degradation.
Weather-balloon service provides the clearest operational example because NOAA published both the reduction and a recovery. Radiosondes measure temperature, humidity, pressure and wind through the atmosphere, observations used in forecasts and models. The April 2025 service notice allowed selected sites to reduce or suspend launches because of staffing limits or operational priorities, while directing users to alternative observations and continuity procedures. Salt Lake City's later restoration shows that staffing solutions and vacancy advertising could reverse a local reduction.
Neither record supports a national failure claim. The service notice did not say all 100 upper-air sites stopped, and the restoration page describes one office. Together they answer a narrower question: staffing constraints were consequential enough to alter a documented observing schedule, and at least one affected office later restored its historical cadence.
That distinction should guide oversight during hurricane season. The appropriate public questions are whether NOAA discloses reduced observing schedules, whether vacancies are filled, whether delayed grants and contracts recover, and whether scientific performance measures are reported consistently. Treating every successful forecast as proof that staffing did not matter would be as unsupported as treating every separation as proof that a forecast failed.
What public data still cannot show
The most consequential missing dimension is line-office assignment. OPM's public NOAA agency record does not say whether the 2,630-person decline was concentrated in the Weather Service, Fisheries, satellite operations, research laboratories, coastal programs, fleet support or headquarters. Historical USAJOBS agency labels are somewhat more specific, but they are too sparse and inconsistent to reconstruct onboard line-office headcount.
Contractors and cooperative institutes are another boundary. NOAA acquires technical services and works with university-based researchers, but no current public roster can be combined safely with OPM's civil-service records. A contract dollar is not a contractor headcount, and a university grant is not an employee assignment. This analysis therefore keeps the federal workforce separate rather than inventing a total labor force.
The workload measures are also contextual rather than causal. Fifteen satellites and 173 stock assessments do not reveal labor hours. The number of hurricane missions changes with storms and research plans. NOAA's ships and aircraft have maintenance periods, and Weather Forecast Offices differ in local hazards and schedules. Without program-level staffing and workload records, no honest analysis can calculate how much thinner a specific shift became.
The strongest conclusion is narrower and still significant. NOAA's agency-wide workforce fell roughly one-fifth from December 2024 through June 2026. Most selected technical occupations remained smaller. Employees with less than five years of service and the broader conditional or probationary group contracted especially fast. Selective hiring had begun in meteorology and hydrology, but it had not produced an agency-wide rebound by midyear.
Methodology and limitations
FederalHiringData used GAO-26-108557 for NOAA's calendar-2025 headcount, separations, rates and probationary-population findings. GAO calculated separation rates using the average of beginning- and end-of-period employment. Its probationary population can include employees serving a supervisory or managerial trial period, not only new hires. We preserve GAO's 2,526 separation count and do not replace it with the 2,675 actions in the current OPM extract.
The workforce series uses OPM legacy FedScope September agency files for 2000 through 2014 and Federal Workforce Data September files for 2015 through 2024. December 2024, January 2025, December 2025 and June 2026 come from current monthly Federal Workforce Data. NOAA is agency subelement CM54. Counts are covered federal employees, not budgeted FTEs, contractors, NOAA Corps officers or all people supporting NOAA work.
Occupation analysis compares January 2025 with June 2026 for ten selected series. The selection is not a complete technical-workforce definition. Tenure group 2 is broader than GAO's probationary population. Length of service and age are reported as published in OPM aggregates. Personnel actions can count events rather than unique individuals, and current-version action totals can differ from earlier official extracts.
Recruiting counts are distinct announcement control numbers in the FederalHiringData historical USAJOBS archive with NOAA, National Weather Service or National Marine Fisheries Service agency labels. Coverage runs from March 2, 2017 through Aug. 13, 2026. Announcements are not vacancies, positions, hires or employees, and repeated or multi-location recruiting can affect totals.
Operating-footprint facts come from official NWS, NESDIS, OMAO, NOAA Fisheries and AOML pages. The radiosonde reduction comes from an official service-change notice; Salt Lake City's restoration comes from its NWS office page. The Science Advisory Board source is an external working-group report to NOAA's advisory board and is characterized accordingly. Analysis was completed Aug. 24, 2026. Article research and writing used no OpenAI API calls.
Official records and further reading
- GAO-26-108557: Federal workforce reductions at selected agencies
- NOAA Science Advisory Board 2026 report
- OPM Federal Workforce Data downloads
- NOAA Office of Marine and Aviation Operations
- NOAA Fisheries stock-assessment report
- Browse current federal jobs
- Explore FederalHiringData statistics
- Read more FederalHiringData investigations
Continue reading
More from FederalHiringData

Data investigationsAugust 23, 2026
NASA Cut Its Civil-Service Workforce 22%. Now It Wants Core Technical Work Back In-House.
NASA lost more than 4,000 civil servants before directing its centers to restore in-house engineering, operations and science capability.

Data investigationsAugust 24, 2026
Federal Student Aid Lost 46% of Its Workforce. Two Loan-Servicer Checks Stopped.
Federal Student Aid stopped two contractor-oversight checks as its covered workforce fell by nearly half while the loan portfolio reached $1.724 trillion.
Data investigationsAugust 18, 2026
IRS Workforce Fell 29% as GAO Warned of Filing-Season Risks
The IRS had 29,663 fewer covered civilian employees in June 2026 than in January 2025. GAO says workforce-planning gaps and post-filing pressures pose risks to future operations.
Federal Hiring Data Weekly
Get the biggest federal workforce changes in your inbox.
Subscribe to Federal Hiring Data Weekly for federal hiring trends, salary data, agency movements, and original investigations, with email confirmation before delivery.