August 26, 2026
FAA's Capital-Area Workforce Fell 13%. A 950-Person Office Plan Is Still Missing.
FAA's capital-area workforce fell 13% while DOT pursued a headquarters consolidation that still lacked a definitive destination for 950 personnel.
By Evan Mercer
Published August 26, 2026Last edited August 26, 2026
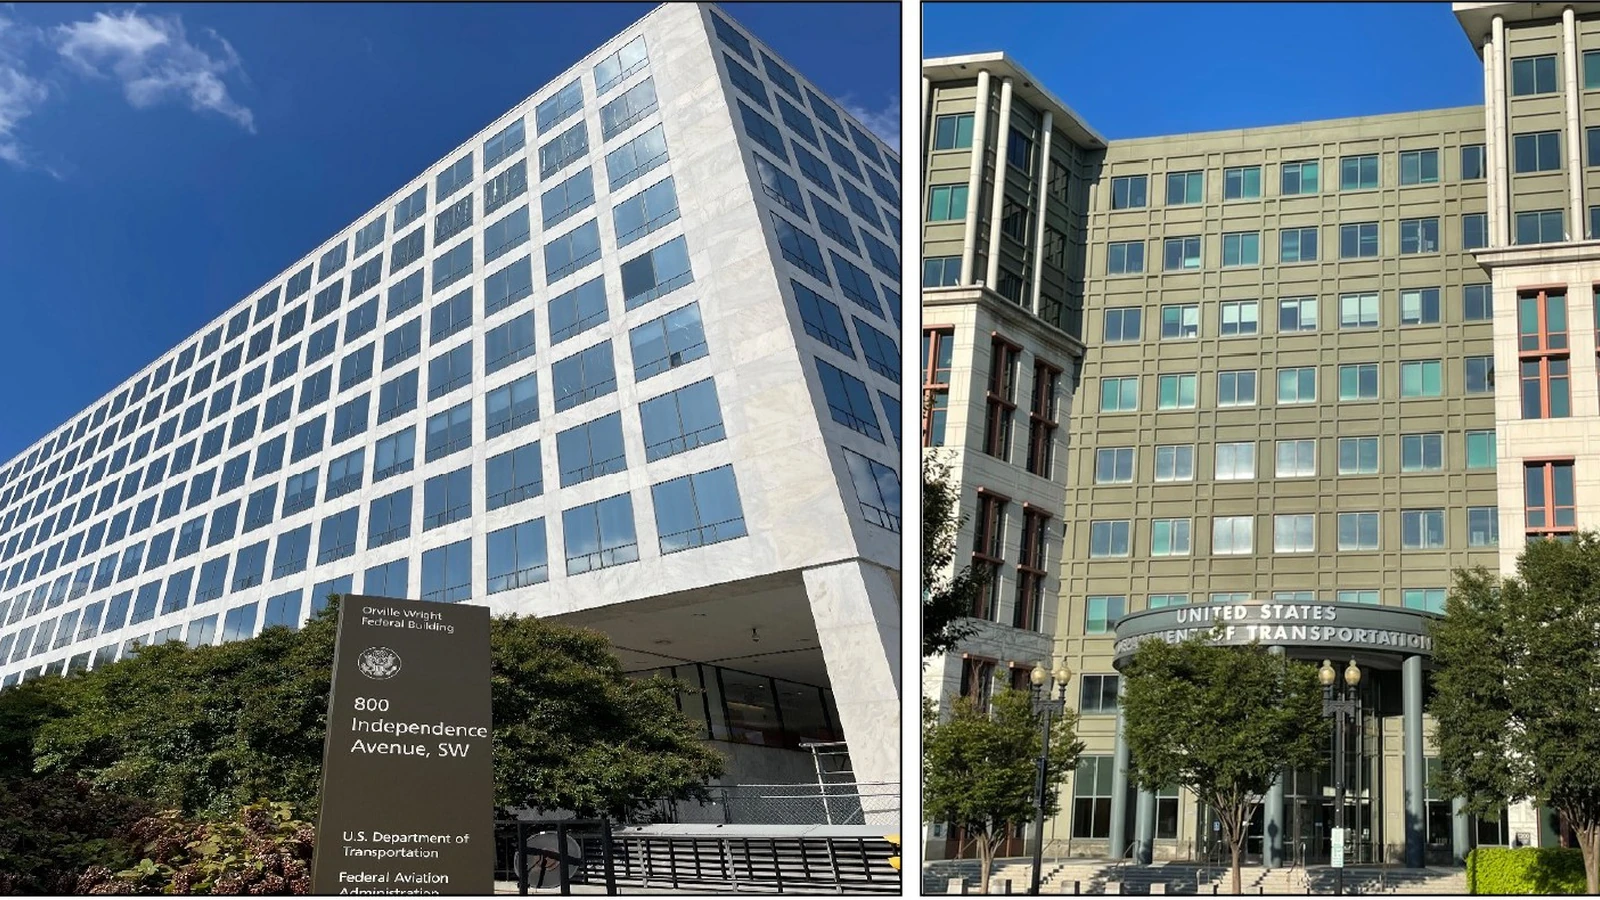
The Department of Transportation is trying to fit thousands of Federal Aviation Administration employees into a headquarters building that was only one-third utilized during a federal audit. The arithmetic almost works. The workforce plan does not.
By June 2026, DOT had offered the FAA about 70% of one tower at its headquarters near the Navy Yard in Washington. Workstations were being made smaller. Storage rooms were being converted. Secure rooms and two round-the-clock operations centers still had to be rebuilt. Yet the department did not have a definitive destination for roughly 950 FAA headquarters personnel, according to a Government Accountability Office report released July 15.
That unresolved group is not the only moving part. FederalHiringData's analysis of Office of Personnel Management records found that FAA's covered workforce in the Washington-Arlington-Alexandria area fell from 5,659 employees in September 2024 to 4,912 in June 2026. The 747-person decline was 13.2%, four times the 3.3% reduction in FAA headcount nationally.
The change was also uneven. The capital area's Management and Program Analysis series lost 230 FAA employees, while Air Traffic Control gained 139. Public USAJOBS recruiting tied to the area fell sharply. Those results do not identify who will move, who has a desk or who works remotely. They show why a building plan based on a single headcount can age quickly: workforce size, skill mix, attendance, specialized space and hiring are changing on different schedules.
FAA's consolidation is therefore more than a real-estate story. It is a test of whether federal space planning can keep pace with workforce geography without turning conditional savings into promises.
One plan, two headquarters and five different denominators
GAO reviewed 189 unique DOT office buildings with more than 5 million usable square feet. During a selected period from Aug. 25 through Sept. 19, 2025, 168 buildings, or 89%, fell below the 60% utilization benchmark in the Utilizing Space Efficiently and Improving Technologies Act.
The audit defined capacity as usable square feet divided by 150 square feet per person. Utilization was average daily in-person attendance divided by that estimated capacity. DOT supplied timecard data for most buildings; FAA login records supplemented the calculation at 80 offices. GAO separately analyzed headquarters badging data and visited 12 locations.
That method produces a utilization estimate. It does not produce a daily census of assigned workers, and it does not classify anyone as remote. One sampled day was a federal holiday. Some DOT employees spend substantial time inspecting or investigating away from their assigned office. A worker can be officially assigned to Washington, report in person regularly and still be absent from a desk while doing field work.
The two headquarters complexes illustrate the denominator problem.
| Measure | DOT headquarters | FAA headquarters |
|---|---|---|
| Usable square feet | 1,034,096 | 794,761 |
| Capacity at 150 square feet per person | 6,894 | 5,298 |
| Average daily attendance in GAO sample | 2,312 | 1,732 |
| Average utilization | 34% | 33% |
| Annual rent | $56.1 million | $47.4 million |
| Annual operations and maintenance | $16.0 million | $8.9 million |
The table does not say that DOT headquarters had 6,894 assigned employees or that FAA headquarters had 5,298. Those are modeled capacities. Nor does average attendance reveal the busiest day, the number of workstations, the distribution by tower or the amount of space that cannot become a desk.

Add the two sampled attendance averages and the combined total is 4,044. Divide that by DOT headquarters capacity and the result is 58.7%, just below the 60% benchmark. That is the appealing arithmetic behind consolidation.
It is not a seating plan. Average attendance can conceal peak-day crowding. A Sensitive Compartmented Information Facility cannot be replaced by an open workstation. The Transportation Operations Center and FAA Washington Operations Center require specialized infrastructure and continuous operations. Some employees may need to remain near a particular function. Others may be assigned to one location but spend time in the field.
The missing 950-person plan is where the clean ratio meets those operating constraints.
The capital-area workforce moved faster than the national one
FAA's national covered workforce has stayed in a relatively narrow band for much of the last decade. OPM data show 45,521 FAA employees in September 2015, 44,288 in September 2019, 46,170 in September 2024 and 44,660 in June 2026.
The longer record is less stable. FAA had 48,825 covered employees in September 2000 and rose to 55,150 in 2002 before falling back. The 2002 increase occurred during a period of major organizational change at DOT; the chart presents the recorded FAA series rather than smoothing it away.

June 2026 is not a year-end figure. It is the latest comparable Federal Workforce Data snapshot in the local research warehouse. Contractors are excluded throughout.
The geographic pattern changed more sharply. FederalHiringData used OPM's Washington-Arlington-Alexandria core-based statistical area, code 47900, for a consistent capital-region comparison from 2015 onward.
FAA's NCR count fell 747 from September 2024 through June 2026, compared with a 1,510-person decline nationally. Put differently, the capital area represented about half of FAA's net national reduction even though it held 12.3% of FAA employees at the starting point. Its share fell to 11.0%.
Across all of DOT, the pattern was stronger. Covered employment nationally fell 7.2%, from 57,014 to 52,923. The NCR count fell 18.2%, from 9,857 to 8,059.

These data do not establish that consolidation caused the decline. Workforce reductions, attrition, accessions, reorganizations and the office project overlapped. OPM records do not identify the 950 employees in GAO's finding or indicate whether an individual has already moved between buildings.
They do establish that the population to be housed was changing materially while designers were reconfiguring the building. A plan based on 2024 staffing cannot be assumed to describe June 2026, much less summer 2027.
Moving between FAA headquarters and DOT headquarters also may not change an employee's OPM duty-station geography. Both buildings are in Washington, about two miles apart. The official duty station can remain inside the same metropolitan area even when the entrance, commute route, workspace and operating environment change. Public personnel data can measure regional distribution; they cannot reconstruct a floor plan.
The skill mix did not shrink evenly
The capital-region decline was concentrated in occupations commonly associated with headquarters policy, administration and technical support, but it was not limited to those roles.
Between September 2024 and June 2026, FAA's NCR Management and Program Analysis series fell from 931 employees to 701, a decline of 230. Miscellaneous Administration and Program fell by 121. Program Management fell by 93, General Engineering by 59, Navigational Information by 52 and Information Technology Management by 48.
Air Traffic Control moved in the opposite direction, rising from 1,566 to 1,705.

| Occupational series | Sept. 2024 | June 2026 | Change |
|---|---|---|---|
| Air Traffic Control (2152) | 1,566 | 1,705 | +139 |
| Management and Program Analysis (0343) | 931 | 701 | -230 |
| Program Management (0340) | 426 | 333 | -93 |
| Misc. Administration and Program (0301) | 397 | 276 | -121 |
| General Engineering (0801) | 358 | 299 | -59 |
| Information Technology Management (2210) | 233 | 185 | -48 |
| Navigational Information (1361) | 217 | 165 | -52 |
| Transportation Specialist (2101) | 200 | 188 | -12 |
| Contracting (1102) | 107 | 93 | -14 |
| Attorney (0905) | 107 | 89 | -18 |
This table is not a roster of headquarters movers. Air-traffic-control employees in the metropolitan area may work at operational facilities rather than either headquarters complex. Engineers, attorneys and program analysts can also work throughout the region. An occupational series describes the job family, not the building or project assignment.
The increase in controllers is valuable counterevidence. FAA's regional workforce did not simply contract by the same percentage in every function. Any space plan must account for where growth occurred as well as where headcount fell. A smaller total population can still need more capacity in a specialized occupation or location.
The decline in headquarters-like series may make the remaining workforce look easier to consolidate numerically. It could also concentrate institutional responsibilities among fewer people. The public data cannot determine which effect dominates. It can show that “FAA headcount” is too broad a unit for judging whether a particular room, secure system or program office can move.
Recruiting fell as the destination question remained open
Federal Hiring Data Weekly
Get the biggest federal workforce changes in your inbox.
Subscribe to Federal Hiring Data Weekly for federal hiring trends, salary data, agency movements, and original investigations, with email confirmation before delivery.
The historical USAJOBS archive provides a second, distinct signal: public recruiting activity.
FederalHiringData counted distinct FAA announcements opened from Jan. 1 through Aug. 14 in each year from 2018 through 2026. Aug. 14 is the comparable cutoff because it is the latest announcement open date in the research warehouse used for this analysis. Capital-region announcements were identified with a conservative city-list proxy covering Washington and selected nearby Virginia and Maryland localities.
National FAA announcements in that window fell from 3,463 in 2024 to 1,826 in 2025 and 784 in 2026. NCR-proxy announcements fell from 581 to 132 and then 51. The region's share declined from 16.8% to 7.2% and 6.5%.

The chart does not count vacancies. One announcement can advertise several positions or many locations, and it may produce no hire. An announcement with any NCR-proxy location is counted once in the regional series. The result also does not capture every internal reassignment, contractor role or hiring action that bypasses a public announcement.
It nevertheless reinforces the workforce evidence. FAA was not replacing capital-area departures through public recruiting at anything close to the 2024 announcement pace. Recruiting had not stopped: the 2026 archive contains Washington-area program managers, attorneys, engineers, IT specialists and other positions. But the channel was much smaller.
This matters for space planning because the next workforce is not necessarily the current workforce. A building can be designed around today's reduced headcount and then confront a different occupational mix if hiring resumes. Conversely, leasing space for an older staffing target can preserve costs after the population has moved lower.
The appropriate response is not to reserve every old desk. It is to publish the assumptions connecting authorized or planned staffing, onboard employees, peak attendance, specialized-space requirements and the time horizon of a lease or renovation.
Underutilization extends far beyond the two headquarters
FAA headquarters was not an isolated low-utilization property. None of the ten highest-cost buildings in GAO's table met 60% during the sample. Rates ranged from 13% at One Aviation Plaza in New York to 47% at 12 New England Executive Park in Massachusetts.

GAO estimated that the 189 sampled buildings carried about $370 million in annual rent, operations and maintenance costs. That is the cost of the sampled portfolio, not an immediately recoverable savings total. An agency cannot stop paying all facility costs merely because measured utilization is below 60%. Leases have terms, owned buildings require maintenance, moves cost money and operational space may not be interchangeable.
A later GSA annual report for DOT found 28.5% office-space utilization during Jan. 12 through March 6, 2026. It reported 282 spaces with 5.36 million office usable square feet. Of those, 258 were below 60%, associated with $86.7 million in fiscal 2024 facility costs.
Those figures are not a new version of the GAO denominator. GSA counted reported spaces; GAO aggregated co-located space into 189 buildings. The periods, methods and cost fields also differ. GSA says 174 spaces relied on timecards, 104 on Wi-Fi or Bluetooth aggregation and four on badge systems. Combining the $370 million and $86.7 million would double count unlike concepts.
The two sources agree on direction: underutilization was widespread even after return-to-office policy changed. They do not say that every low rate has the same cause or remedy.
The January 2025 return-to-in-person memorandum directed agencies to end remote-work arrangements and require full-time in-person work at duty stations, subject to exemptions agency heads considered necessary. GAO's sample came later in 2025. Yet inspectors, investigators and other field-oriented employees can be in official in-person status without occupying their assigned desk all day. A holiday in the sample also reduced one day's attendance.
Calling every gap between capacity and attendance “remote work” would be unsupported. Capacity can exceed assigned headcount. Attendance can be below headcount. Both can be true even when telework is limited.
The savings case is real, but conditional
DOT's consolidation has a plausible financial case. GAO reported an estimated $91 million total project cost. About $12 million had been spent by June 2026. The department's fiscal 2027 budget requests $60 million for consolidation, secure-space improvements and integration of the two operations centers.
The budget request is a proposal, not evidence that Congress appropriated the amount or that it has been spent.
Related research
Put this finding in context

Data investigationsAugust 23, 2026
FAA's Aviation-Weather Network Was Designed for 90 Meteorologists. Staffing Fell to 69.
The last verified federal count found 69 meteorologists in a 90-position aviation-weather design. Public records show recruiting in 2026, but not a verified recovery.

Data investigationsAugust 24, 2026
FAA Received 23 Electric-Propulsion Projects. Its Certification Skill-Gap Review Is on Hold.
FAA says current electric-aircraft projects remain supported, but two certification branches reported an eight-position specialty gap as a selected technical workforce fell 7.3%.
If DOT fully vacates FAA headquarters, GAO estimated it could avoid roughly $56 million per year in GSA rent and operations and maintenance costs. If GSA successfully disposes of the property, the government might also avoid about $131 million in deferred maintenance. By June, four other Washington-area FAA leases had been terminated or were planned for termination.

Each number has a different status. The $91 million is an estimated project cost. The $12 million is reported spending. The $60 million is requested funding. The $56 million is an annual estimate conditional on full vacation. The $131 million is a possible one-time avoidance conditional on disposal.
GAO warned that the 950-person destination gap could reduce or eliminate projected savings if DOT cannot fully vacate FAA headquarters or must obtain other leased space. The department also had not supplied a detailed final savings estimate that incorporated the actual move plan.
This does not mean consolidation is uneconomic. Keeping two headquarters at roughly one-third sampled utilization has a cost. It means the savings claim must remain a scenario until personnel, space, timing and replacement costs are resolved.
DOT has divided the work into phases running from September 2025 through mid-2027. By June 2026, planners were converting offices, shrinking workstations and preparing secure facilities. The department said full FAA headquarters vacation remained its goal for summer 2027. GAO's first recommendation asks DOT to finish a plan that identifies destinations for all staff and estimated savings. The recommendation remained open when FederalHiringData rechecked it on Aug. 26.
What a complete workforce-space plan should show
FAA's case reveals a missing public bridge between personnel and property data.
OPM can show covered employees by duty station and occupation. GAO and GSA can show capacity, usable square feet and measured attendance. USAJOBS can show public recruiting. Budgets can show requested move money. None of those sources connects a named workforce population to a final building plan.
A complete public plan would report at least:
- assigned and onboard employees by destination, separated from modeled capacity;
- peak-day as well as average attendance;
- workstations, shared seats and reservation assumptions;
- secure, operations, laboratory, storage and public-service space separately;
- employee occupations or functions at a level that does not expose personal information;
- telework and field-work assumptions without treating them as the same thing;
- renovation, move, lease, operations and maintenance costs on a common timeline;
- any replacement leases needed for people or functions that do not fit;
- expected duty-station changes and documented workforce-relocation effects;
- realized savings after the moves, not only projected avoidance.
Such a plan would allow the public to evaluate both sides of the decision. It could show when a building truly carries excess interchangeable office space and when apparently empty capacity supports specialized or variable work. It could also reveal whether headcount reductions are being incorporated into property decisions quickly enough to avoid building for a workforce that no longer exists.
The current evidence supports neither an anti-office nor a pro-office verdict. It supports a planning standard.
FAA's capital-area workforce has already changed faster than its national headcount. Its occupational mix moved in different directions. Its public regional recruiting fell. Its two headquarters buildings were lightly utilized by the statutory measure. And its consolidation still lacked a destination for 950 people less than two years before the planned full vacation.
The potential savings deserve attention. So does the unresolved workforce map underneath them.
Methodology and limitations
FederalHiringData analyzed public OPM FedScope and Federal Workforce Data records for the Federal Aviation Administration, agency subelement TD03. The national long-run series uses September employee-level files for 2000-2014, September observations for 2015-2025 and June 2026 as the latest partial-year point. The NCR analysis uses Washington-Arlington-Alexandria CBSA code 47900 from 2015 onward. OPM records cover federal civilian employees and exclude contractors.
Duty station is an official personnel geography, not a building-entry record, telework classification or guarantee that a worker will move. Occupation series do not identify office, program or consolidation assignment.
Historical USAJOBS counts use exact canonical FAA agency identity and distinct control numbers opened from Jan. 1 through Aug. 14 in each year. FederalHiringData's historical USAJOBS coverage begins in March 2017; the comparison starts in 2018. The NCR series uses Washington, D.C., and a conservative list of nearby Virginia and Maryland localities. The archive was current through an Aug. 14, 2026 announcement open date when analyzed. Announcements are not vacancies, applications, selections or hires.
GAO's utilization method, limits and financial statuses are preserved as described in GAO-26-108089. The combined-attendance ratio is FederalHiringData arithmetic using GAO's two headquarters averages, not a DOT forecast. GSA's March 2026 figures are shown separately because its reporting scope differs.
Public records reviewed through Aug. 26 did not identify the affected 950 employees, final destinations, peak-day needs, individual commute effects, contractor support, final appropriations, replacement leases or realized savings. No causal claim is made between consolidation and workforce decline.
Hero image: FAA headquarters and DOT headquarters in Washington, U.S. Government Accountability Office, GAO-26-108089.
Readers can explore current federal job listings, FederalHiringData statistics, the FAA controller hiring-pipeline investigation, and the full article archive.
Continue reading
More from FederalHiringData

Data investigationsAugust 24, 2026
TSA Has More Than 1,300 Aviation Inspectors. Its Cybersecurity Role Map Is Outdated.
TSA added aviation cybersecurity requirements as its broad inspection and compliance workforce contracted and its public cyber role map remained outdated.
Data investigationsAugust 24, 2026
Aguadilla Crossed TSA's Cargo Threshold. Permanent Inspectors Still Weren't Stationed There.
Puerto Rico's cargo system relied on three federal inspection missions with different hours and staffing constraints, while public data could not show the full airport-level gap.

Data investigationsAugust 25, 2026
The Coast Guard Plans to Add 15,000 Military Members. Only 26% of Its Workforce Requirements Are Current.
Recruiting rebounded, but cutter vacancies widened and covered civilian employment fell 9.9% as Force Design accelerated.
Federal Hiring Data Weekly
Get the biggest federal workforce changes in your inbox.
Subscribe to Federal Hiring Data Weekly for federal hiring trends, salary data, agency movements, and original investigations, with email confirmation before delivery.