August 27, 2026
The Median FEHB Family Increase Took 94% of a Rest-of-U.S. GS-7 Raise
OPM plan-level rates show the median 2026 family premium increase absorbed 94% of one Rest-of-U.S. GS-7 step 5 scheduled raise.
Published August 27, 2026Last edited August 27, 2026
A Rest-of-U.S. employee at GS-7 step 5 moved from $56,623 in scheduled annual pay in 2025 to $57,188 in 2026. That was a $565 gross increase.
Now place that employee in the middle of the Federal Employees Health Benefits plan changes. Among Self and Family enrollment codes offered in both years, the median employee contribution rose $20.44 every two weeks, or $531 over 26 pay periods. The premium increase alone would absorb 94% of that scheduled gross raise.
The example is deliberately narrow. It is not a take-home-pay calculation, and it does not claim that a particular GS-7 employee chose the median plan. But it converts two abstractions — a 1% pay adjustment and a 12.3% average FEHB enrollee-share increase — into the dollar comparison employees actually face.
FederalHiringData matched every active non-Postal FEHB enrollment code that appeared in both OPM's 2025 and 2026 rate files. More than four in five of the 387 comparable codes charged employees more in 2026. The median annual increase was $213 for Self Only, $447 for Self Plus One and $531 for Self and Family. Yet 71 codes became cheaper, and individual changes ranged far beyond the medians.
That variation is the central finding. The average premium headline correctly identifies broad cost pressure, but it cannot tell an employee how much of a raise disappeared. Salary, enrollment tier and the exact three-character plan code determine the answer.

What employees actually paid more
OPM's public-use rate files list the employee and government share for each plan option and enrollment type. FederalHiringData selected the active non-Postal, biweekly employee rate, built the full enrollment code, and joined 2025 to 2026 on that code.
The 2025 file contained 438 active biweekly enrollment codes. The 2026 file contained 396. Exact matching found 387 codes in both years: 129 in each enrollment tier. Fifty-one 2025 codes were absent from the 2026 file, while nine 2026 codes were new. Those unmatched options were excluded rather than treated as zero or forced onto a different plan.
The result is a plan menu, not an enrollee-weighted population. OPM does not include enrollment counts in the rate workbooks, so FederalHiringData did not invent weights. The medians below give every matched enrollment code one vote. OPM's official weighted averages, discussed separately, answer a different question.
| Enrollment tier | Matched codes | Median biweekly increase | Median annual increase | Median percent increase | Codes that increased | Codes that decreased |
|---|---|---|---|---|---|---|
| Self Only | 129 | $8.20 | $213 | 9.1% | 106 | 23 |
| Self Plus One | 129 | $17.21 | $447 | 8.5% | 104 | 25 |
| Self and Family | 129 | $20.44 | $531 | 8.5% | 106 | 23 |
The annualization multiplies the biweekly difference by 26. It does not include deductibles, copays, coinsurance, prescription costs or other out-of-pocket spending. It also does not value a benefit change. A plan can raise its premium while improving coverage, or lower its premium while changing the network or cost-sharing rules.
Readers can inspect the downloadable matched-code file, including both years' employee and government contributions. It is a calculation from OPM source data, not an OPM-issued comparison table.
The middle did not describe the edges
The median is useful because a handful of very expensive regional or limited-eligibility options cannot pull it upward. It is still only the midpoint.
For Self and Family, the 25th-percentile annual change was $230, the median was $531, the 75th percentile was $1,821, and the 90th percentile was $4,060. Sixty-six of 129 matched family codes increased by more than $500 annually; 51 increased by more than $800; 39 increased by more than $1,200.
Self Plus One was similarly dispersed. Its 25th-percentile increase was $156, its median $447, its 75th percentile $1,590 and its 90th percentile $3,673. Self Only changes were smaller in dollars but still ranged widely: $92 at the 25th percentile, $213 at the median, $761 at the 75th and $1,693 at the 90th.

The decreases are important counterevidence. Twenty-three matched Self Only codes, 25 Self Plus One codes and 23 family codes charged employees less in 2026. Across all tiers, 18.3% of comparable codes decreased. The broad premium story was upward, but “everyone paid more” would be false.
OPM's own 2026 Open Season summary reports an enrollment-weighted average enrollee-share increase of 12.3%, an overall average premium increase of 10.2%, and a 9.2% increase in the government contribution. OPM can weight by the prior enrollment distribution; FederalHiringData's public rate-file median cannot.
Those statistics can differ without conflict. The OPM average describes how rate changes fall across the existing enrollment population before Open Season switching. The FederalHiringData median describes the middle option in the matched plan-code menu. An employee needs the exact dollar row for the plan they hold or are considering.
Premium growth outran scheduled pay for six years
The 2026 mismatch was not isolated. OPM's comparable historical table begins in 2021. In every year through 2026, the agency's average enrollee-share increase exceeded the average scheduled GS adjustment.
| Year | Average FEHB enrollee-share increase | Average GS pay adjustment | Gap |
|---|---|---|---|
| 2021 | 4.9% | 1.0% | 3.9 points |
| 2022 | 4.1% | 2.7% | 1.4 points |
| 2023 | 8.7% | 4.6% | 4.1 points |
| 2024 | 7.7% | 5.2% | 2.5 points |
| 2025 | 13.5% | 2.0% | 11.5 points |
| 2026 | 12.3% | 1.0% | 11.3 points |

The percentages use different dollar bases. A 12.3% increase on a health premium is not automatically larger in dollars than a 1% increase on salary. The chart shows that the deduction grew faster, not that every employee suffered a net loss.
It also does not include career movement. A promotion, within-grade increase, special salary rate, retention payment, overtime or other change can raise an individual's gross pay more than the annual table adjustment. Employees who remained at the same grade and step provide the cleanest comparison because the scheduled table change can be observed directly.
The historical boundary is six years because that is the comparable series OPM publishes in its current Open Season materials. Older premium documents exist, but FederalHiringData did not splice unlike summaries into a 10- or 20-year line merely to lengthen the chart.
The six-year result nevertheless adds context to the current frustration. The premium-pay gap narrowed in 2022 and 2024 when scheduled pay adjustments were larger. It widened dramatically in 2025 and remained almost as wide in 2026, even though OPM said the overall premium increase slowed from the prior year.
What 1% meant at actual GS rates
The 2026 pay memorandum authorized a 1% across-the-board increase and left locality percentages at their 2025 levels. Rounding in salary tables means the exact dollar change is close to, but not always precisely, 1% of the prior annual rate.
FederalHiringData compared the same Step 5 in OPM's Rest-of-U.S. and Washington-Baltimore-Arlington tables. The table below pairs those exact gross changes with the $531 median family premium increase.
| 2025-2026 salary example | 2025 rate | 2026 rate | Scheduled gross raise | Median family increase | Share absorbed |
|---|---|---|---|---|---|
| Rest of U.S., GS-5 step 5 | $45,707 | $46,167 | $460 | $531 | 115.5% |
| Rest of U.S., GS-7 step 5 | $56,623 | $57,188 | $565 | $531 | 94.1% |
| Rest of U.S., GS-9 step 5 | $69,259 | $69,954 | $695 | $531 | 76.5% |
| Rest of U.S., GS-12 step 5 | $100,440 | $101,443 | $1,003 | $531 | 53.0% |
| Washington locality, GS-5 step 5 | $52,298 | $52,825 | $527 | $531 | 100.8% |
| Washington locality, GS-7 step 5 | $64,788 | $65,435 | $647 | $531 | 82.1% |
| Washington locality, GS-12 step 5 | $114,923 | $116,071 | $1,148 | $531 | 46.3% |

For a Rest-of-U.S. GS-5 step 5 employee, the median family premium increase exceeded the scheduled gross raise by $71. At GS-7 step 5, it left $34 before taxes and every other deduction or price change. At GS-12 step 5, the same premium increase took 53% of the gross scheduled raise.
Federal Hiring Data Weekly
Get the biggest federal workforce changes in your inbox.
Subscribe to Federal Hiring Data Weekly for federal hiring trends, salary data, agency movements, and original investigations, with email confirmation before delivery.
Self Only changes generally absorbed less. The $213 median was 46.3% of the Rest-of-U.S. GS-5 example, 37.7% of GS-7, 30.7% of GS-9 and 21.3% of GS-12. The $447 Self Plus One median took 97.3%, 79.2%, 64.4% and 44.6%, respectively.
These are illustrations, not employee records. FederalHiringData does not know which plan each person in OPM workforce data selected, and it does not pair identifiable salaries with health enrollment. The comparison uses public schedules precisely to avoid pretending otherwise.
Nor is gross pay the same as net pay. Most active employees have FEHB premium conversion, which generally deducts the employee contribution before federal income, Social Security and Medicare taxes. Retirement contributions, state taxes, life insurance and other deductions vary. Saying the premium “took” part of the scheduled gross raise describes a dollar budget comparison, not the exact change on a pay statement.
The plan code changed the result
Selected familiar nationwide or broadly available options show why a program average cannot substitute for the enrollment-code row. For Self and Family coverage, the annual employee contribution increase ranged from $367 for GEHA HDHP to $1,904 for APWU High among the examples below.
| Selected Self and Family option | Code | 2025 biweekly | 2026 biweekly | Annual increase | Percent increase |
|---|---|---|---|---|---|
| GEHA HDHP | 342 | $201.52 | $215.63 | $367 | 7.0% |
| GEHA Standard | 315 | $214.30 | $231.45 | $446 | 8.0% |
| MHBP Value | 415 | $146.29 | $163.85 | $457 | 12.0% |
| FEP Blue Focus | 132 | $139.92 | $157.97 | $469 | 12.9% |
| MHBP Standard | 455 | $194.82 | $218.20 | $608 | 12.0% |
| FEP Blue Standard | 105 | $424.65 | $457.66 | $858 | 7.8% |
| APWU Consumer Driven | 475 | $203.90 | $238.56 | $901 | 17.0% |
| FEP Blue Basic | 112 | $303.61 | $356.86 | $1,385 | 17.5% |
| GEHA Elevate | 255 | $169.84 | $228.85 | $1,534 | 34.7% |
| APWU High | 472 | $264.50 | $337.72 | $1,904 | 27.7% |

This is not a value ranking or a plan recommendation. A lower premium increase does not prove lower total cost. Deductibles, copays, coinsurance, out-of-pocket maximums, prescription formularies, health-savings-account contributions, provider networks, service areas and membership eligibility can differ. Even plans under the same carrier name can have materially different rules.
The selected examples also should not be mistaken for the complete menu. Regional plans and options available only to particular groups are part of the 387-code distribution. The downloadable file provides the full matched set; OPM's plan comparison tool and official brochures provide the benefit detail needed for an enrollment decision.
The government contribution rose, too
FEHB is not an employee-only premium. Under OPM's Fair Share formula, the government generally pays the lesser of 72% of the program-wide weighted average premium or 75% of the selected plan's total premium. The employee pays the balance.
For 2026, the maximum biweekly government contribution rose to $324.76 for Self Only, $711.17 for Self Plus One and $778.03 for Self and Family. Annualized, the increases from 2025 were $694, $1,590 and $1,659.
| Enrollment tier | Maximum government share, 2025 | Maximum government share, 2026 | Annualized increase | Median employee annual increase |
|---|---|---|---|---|
| Self Only | $298.08 | $324.76 | $694 | $213 |
| Self Plus One | $650.00 | $711.17 | $1,590 | $447 |
| Self and Family | $714.23 | $778.03 | $1,659 | $531 |

For most matched codes, the government amount increased by the maximum for the enrollment tier. That does not cap the employee's increase at the same rate. When a plan's total premium rises beyond the applicable government contribution, the remaining difference falls to the enrollee. In lower-cost plans, the separate 75%-of-plan-premium limit can apply instead.
The contribution is real compensation financed by agency appropriations or other salary funds, but it is not cash added to an employee's paycheck. The comparison in this article asks what happened to the employee's payroll deduction, while acknowledging that taxpayers and employing agencies absorbed a larger dollar increase too.
What to carry into Open Season
The analysis supports a process, not a plan choice.
Related research
Put this finding in context
Pay and benefitsAugust 27, 2026
Eight GS-15 Steps Pay the Same in San Francisco. Federal Pay Compression Has Spread to 37 Localities.
FederalHiringData found 21,453 identifiable GS-15 employees in officially capped steps as the 2026 ceiling flattened upper rates in 37 locality tables.
Pay and benefitsAugust 27, 2026
One in Four USAJOBS Announcements Outside Urban Areas Advertised a Hiring Incentive
FederalHiringData found incentive language in 26.43% of exact-location postings outside Census urban areas, versus 17.57% inside them.
First, compare the employee share, not the total premium and not only OPM's program average. The three-character enrollment code is the cleanest check because similar carrier names can contain several options and tiers.
Second, convert the biweekly change to an annual amount. A difference that looks modest on one pay statement repeats 26 times for most active employees. That number can then be compared with the scheduled gross raise, but it still should not be called a net-pay forecast.
Third, compare benefits alongside the premium. OPM explicitly advises enrollees to review plan quality and coverage, not rates alone. Provider participation, prescriptions, expected medical use and risk tolerance can matter more than a small premium difference.
Fourth, verify eligibility and service area. Some fee-for-service options require membership in a sponsoring organization, and regional HMOs can limit enrollment to people who live or work in covered areas.
The selected-plan calculation is straightforward once the right row is located. Start with the 2025 and 2026 biweekly employee contributions for the same enrollment code, subtract the earlier amount from the later amount, and multiply the difference by 26. Then compare that annual premium change with the employee's actual scheduled salary-table change, not with the national average pay-adjustment percentage alone. For example, a $20 biweekly increase is $520 over a standard 26-pay-period year. Whether that consumes half, nearly all or more than all of the scheduled raise depends on the employee's grade, step and locality.
That arithmetic is only the first screening step. A plan whose employee premium increased less could still expose a household to higher deductibles or cost sharing; a plan whose premium increased more could preserve a network or benefit that matters to that household. An enrollee also needs to check whether a familiar plan name retained the same enrollment code and option. The exact-code approach used here prevents a discontinued plan from being compared with an unrelated replacement, but it cannot determine which option offers the best value for a particular family.
OPM says employees may change plans, options or enrollment types during the annual Federal Benefits Open Season. Certain qualifying life events also permit changes outside Open Season. This article analyzes 2026 rates already in effect; it does not predict 2027 premiums or tell an enrollee to switch.
What the comparison does not prove
It does not show that the 1% adjustment caused premium changes, or that carriers priced plans in response to federal pay. OPM attributed the 2026 rate pressure primarily to provider and supplier costs, prescription-drug use — including specialty and GLP-1 drugs — and behavioral-health spending.
It does not establish that benefits became better or worse in proportion to premiums. A rate workbook cannot measure network access, claims experience or the value an employee received from coverage.
It does not describe Postal Service employees, who moved to the separately administered Postal Service Health Benefits Program in 2025. It also excludes special rate categories for FDIC employees, temporary employees, former spouses, Temporary Continuation of Coverage and tribal employees.
It does not say that every GS employee received exactly 1% more in total compensation. The article holds grade, step and locality constant to isolate scheduled table movement. Personnel actions and other pay components can change an individual's result.
And it does not estimate take-home pay. Taxes and deductions differ, while premium conversion makes many active-employee FEHB contributions pre-tax. A worker whose family premium rose $531 did not necessarily see net pay fall by $531 relative to the new salary.
Methodology and limitations
FederalHiringData downloaded OPM's Sept. 27, 2024 FEHB rate public-use file for plan year 2025 and its Oct. 23, 2025 file for plan year 2026. The study selected active non-Postal employee rates paid biweekly. For 2025, the enrollment code was reconstructed from the plan-code and enrollment-type fields; for 2026, OPM supplied the two components separately. Payroll-rate workbooks were used as a structural cross-check.
The exact-code join produced 387 comparable rows from 438 active 2025 rows and 396 active 2026 rows. Each tier contained 129 matches. FederalHiringData calculated employee and government changes from the published dollar amounts. Annual amounts use 26 biweekly pay periods. No rate was imputed for an unmatched option.
Plan-level medians and percentiles are unweighted. The public-use rate files do not include plan enrollment, and the analysis does not infer it. OPM's 12.3% enrollee-share, 10.2% total-premium and 9.2% government-contribution figures are OPM's separately published enrollment-weighted averages.
Salary illustrations use exact annual rates for the same Step 5 in OPM's 2025 and 2026 Rest-of-U.S. and Washington-Baltimore-Arlington salary tables. The share absorbed divides the median annual employee premium change by that scheduled gross salary change. Results do not represent an identifiable person or an observed pairing of salary and insurance enrollment.
The historical comparison uses OPM's published 2021-2026 average enrollee-share series and annual OPM GS pay-adjustment memoranda. Average premium growth and average pay growth are rates on different bases. The chart does not add or subtract those percentages to estimate net compensation.
The article's topic was selected partly because two 2025 r/fednews discussions about 2026 FEHB rates drew roughly 550 and 506 points. Reddit was used only as a demand signal. Comments were not evidence for any rate, plan-quality, salary or policy claim.
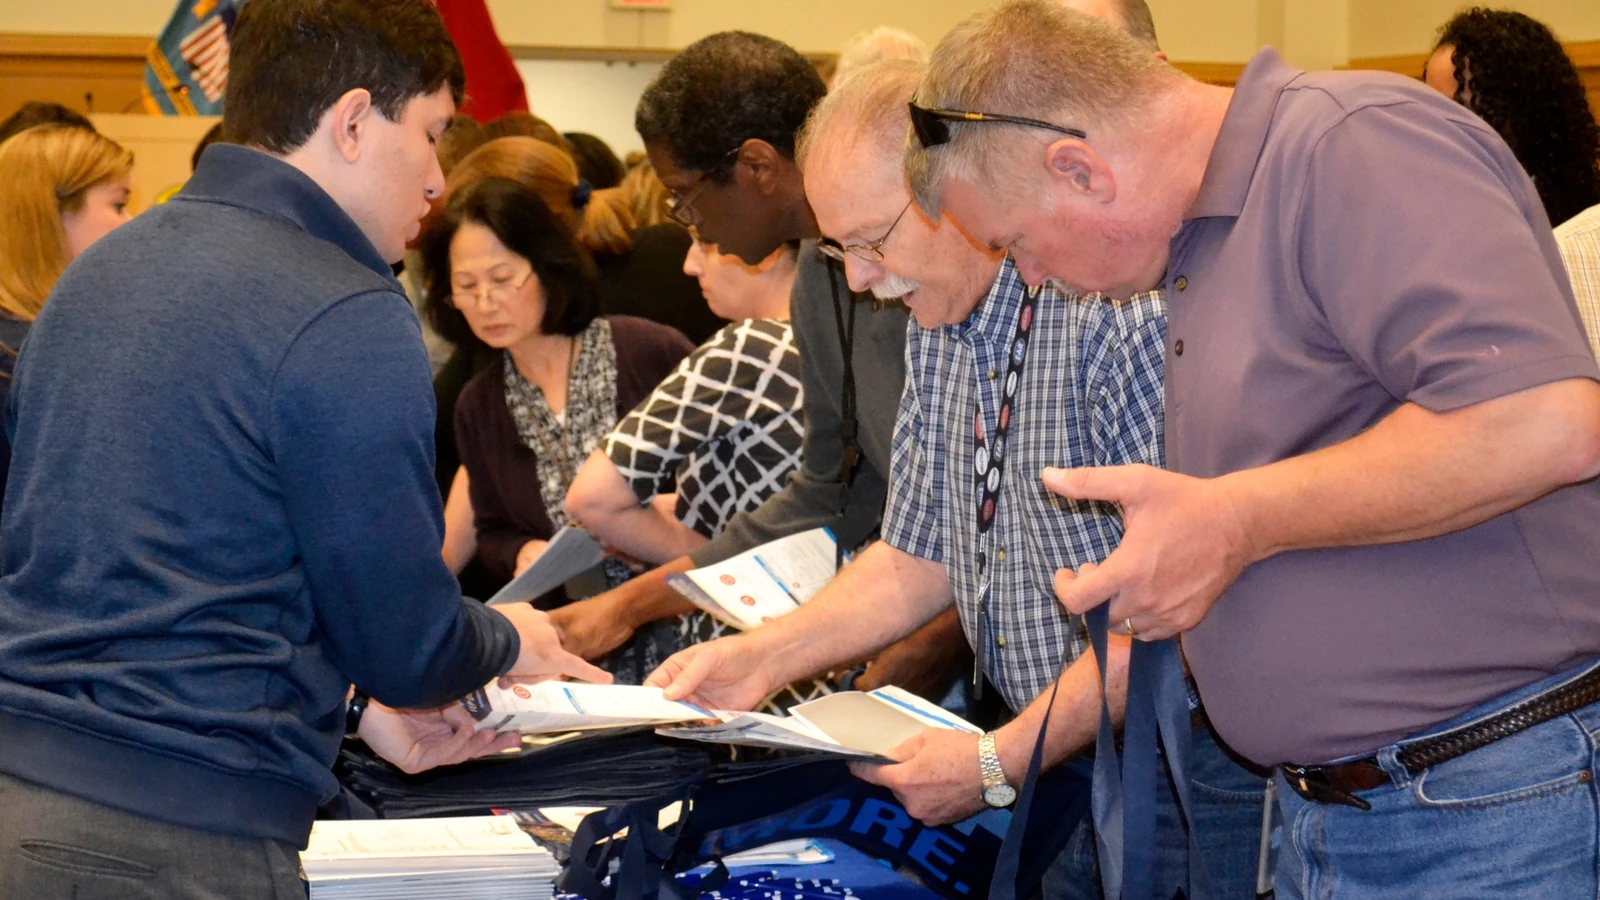
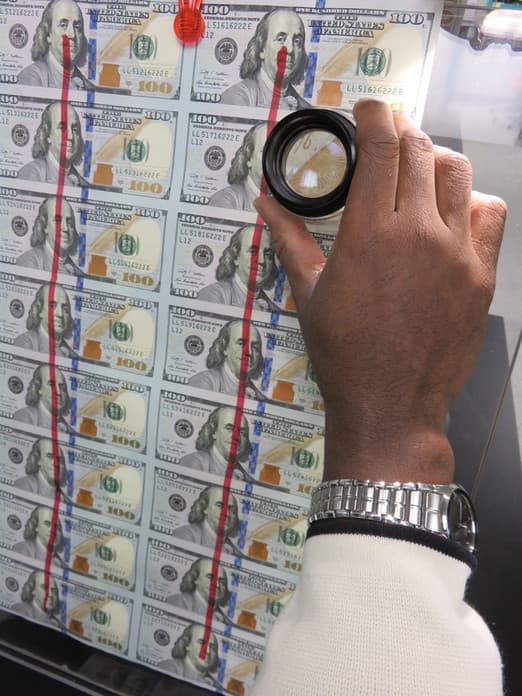
Photo: Shaun Eagan, Defense Logistics Agency, via DVIDS, public domain.
Continue reading
More from FederalHiringData
Pay and benefitsAugust 27, 2026
The TSP Now Lets Ages 60-63 Save $35,750. FERS Savers Ages 60-69 Averaged 10.8%.
The TSP raised contribution ceilings and added Roth rules in 2026, but FRTIB and OPM data show why the changes reach federal savers unevenly.
Pay and benefitsAugust 19, 2026
Federal Pay Rose 14%. Prices Rose Nearly Twice as Fast.
Consumer prices rose 27.7% from January 2021 through July 2026 while the GS base schedule rose 14.4%. Locality pay narrowed, but did not erase, the loss in scheduled purchasing power.

Pay and benefitsAugust 18, 2026
TSP Loan and Hardship-Withdrawal Use Rose in 2025
TSP loan use reached 9.5% of active FERS participants and hardship-withdrawal use reached 4.9%, even as participation, deferrals and account balances also increased.
Federal Hiring Data Weekly
Get the biggest federal workforce changes in your inbox.
Subscribe to Federal Hiring Data Weekly for federal hiring trends, salary data, agency movements, and original investigations, with email confirmation before delivery.