August 29, 2026
A County Line Can Change a Federal Salary by $39,391
A national analysis of OPM pay tables and Census county borders found 1,262 neighboring county pairs where the same GS grade and step can pay differently.
Published August 29, 2026Last edited August 29, 2026
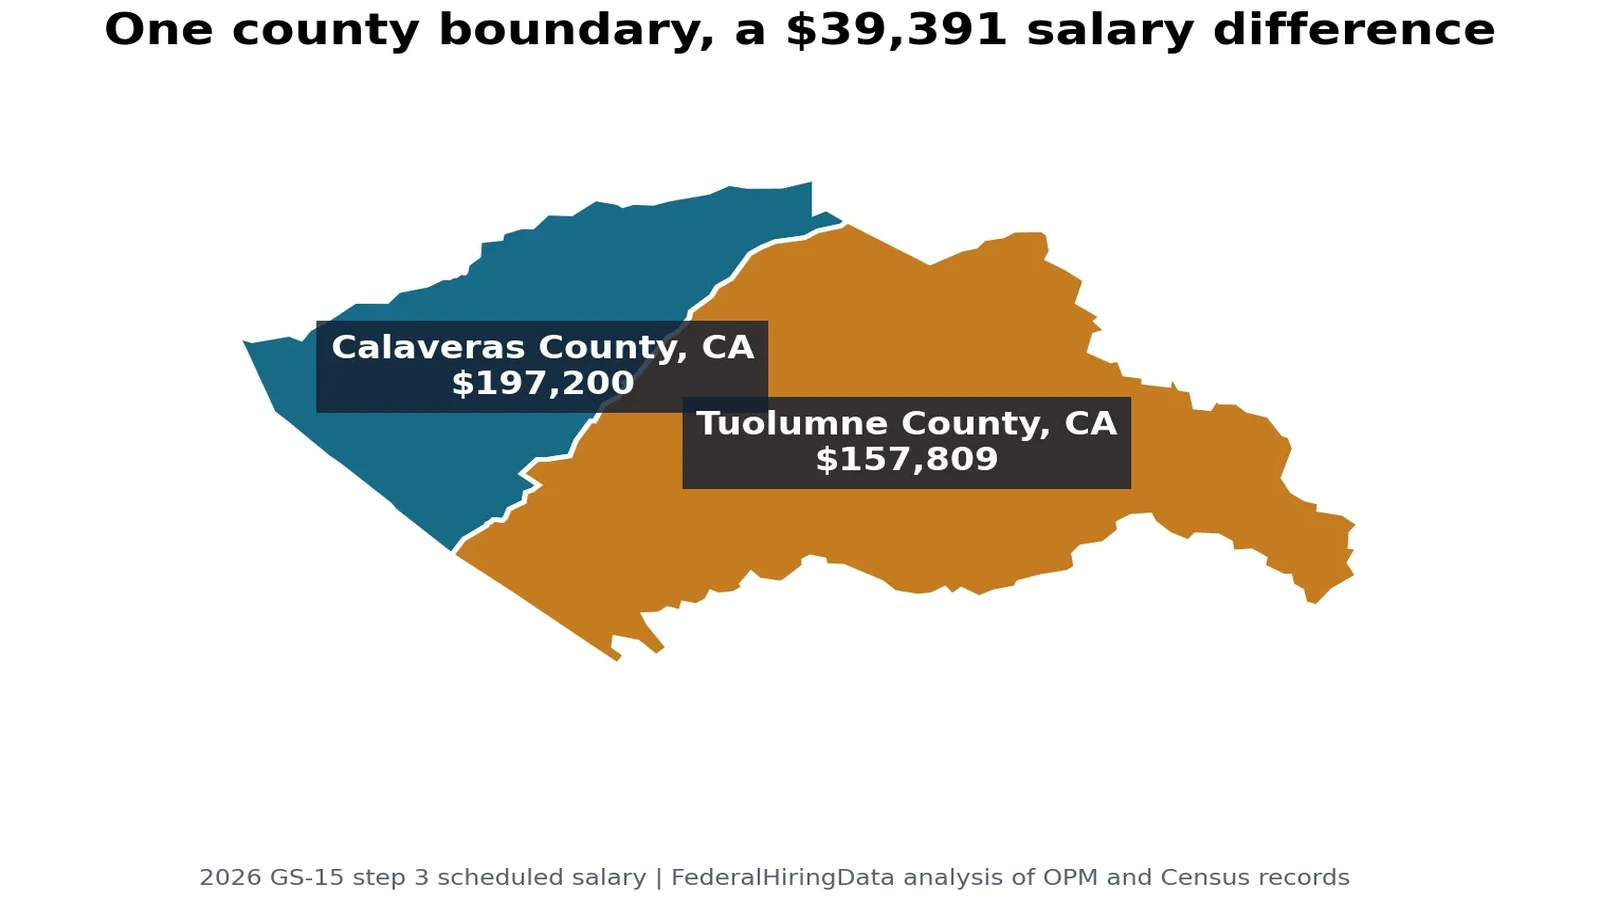
A federal employee working in Calaveras County, California, can sit at the same General Schedule grade and step as a colleague in neighboring Tuolumne County and still have a very different number on the salary table.
For 2026, Calaveras is assigned to the San Jose-San Francisco-Oakland locality pay area. Tuolumne is assigned to Rest of U.S. At GS-12 step 5, the official annual rates are $126,817 and $101,443. The scheduled difference is $25,374. At GS-15 step 3, it reaches $39,391: $197,200 on the Calaveras side and $157,809 on the Tuolumne side.
This is not an estimate based on housing prices, commuting costs or a salary website. FederalHiringData joined every 2026 Office of Personnel Management General Schedule table to OPM's county definitions, then joined those counties to the Census Bureau's national adjacency file. The result is a map of 1,262 neighboring county pairs that cross a locality-pay boundary. They represent 101 distinct locality-to-locality pairings.
Nor is the difference evidence that one county is more deserving, more expensive or easier to staff. Locality pay is not a cost-of-living adjustment. Under federal law and OPM's methodology, it is built from comparisons between federal and nonfederal salaries for work at comparable levels in defined labor markets. The line matters because OPM put the counties in different pay areas.
The practical consequence is straightforward: geographic proximity does not guarantee pay-table equivalence. Applicants comparing federal offers, employees considering a reassignment and managers describing a duty station need the exact official worksite, not merely the nearest city or the employee's home address.
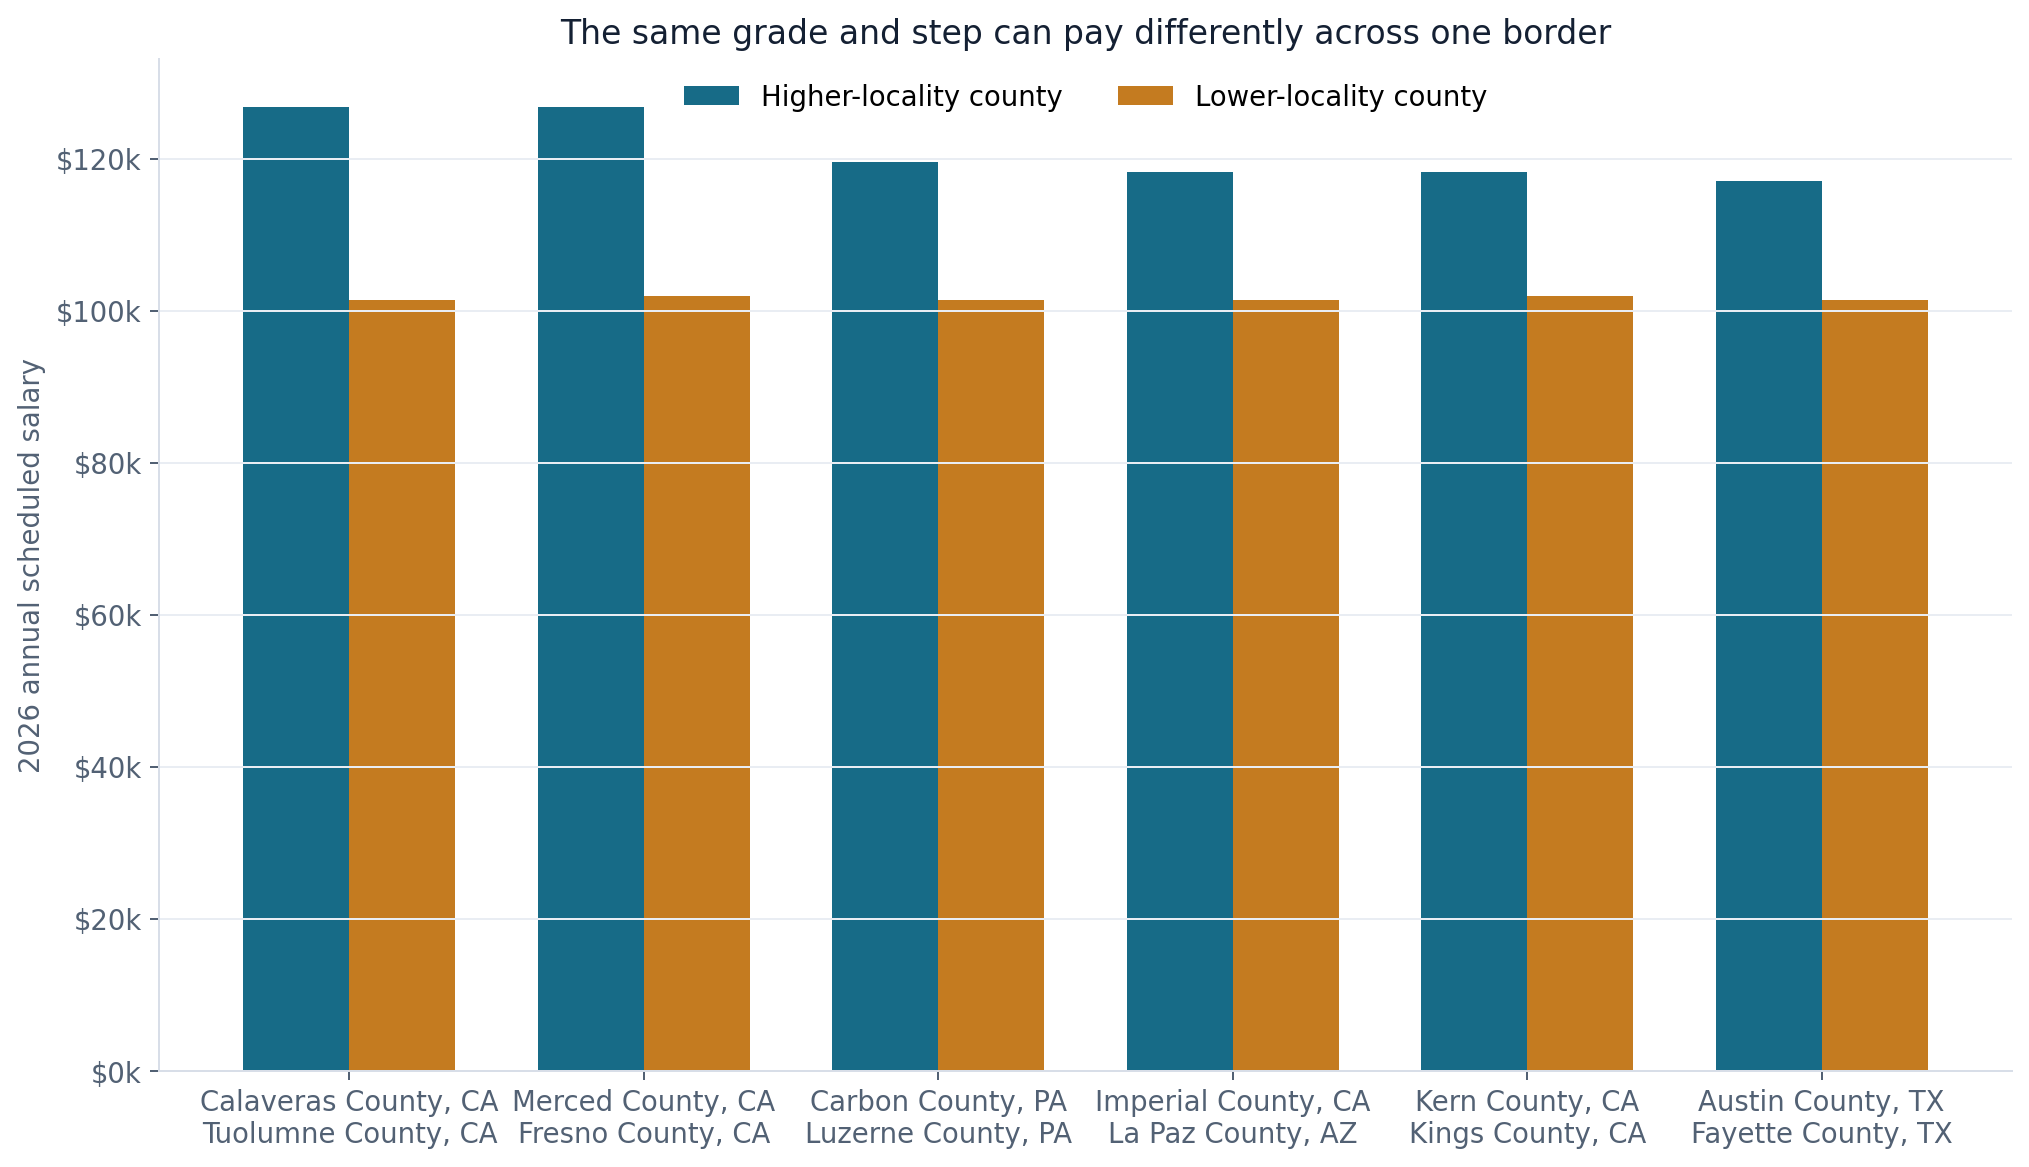
The largest county-line differences are concentrated in a few pay-area boundaries
The largest dollar gaps do not necessarily occur at the largest percentage difference. Each locality table rounds annual rates to whole dollars, and the statutory cap compresses some upper steps. FederalHiringData therefore calculated two measures for every cross-locality county pair: a representative GS-12 step 5 comparison and the largest dollar difference found at any matching grade and step.
The Calaveras-Tuolumne line leads both measures. The San Francisco area's 2026 locality payment is 46.34%, compared with 17.06% for Rest of U.S. The GS-12 step 5 salary is 25.0% higher when measured against the lower scheduled salary. At GS-15 step 3, before the higher table becomes constrained by the cap at later steps, the dollar gap reaches the article's $39,391 maximum.
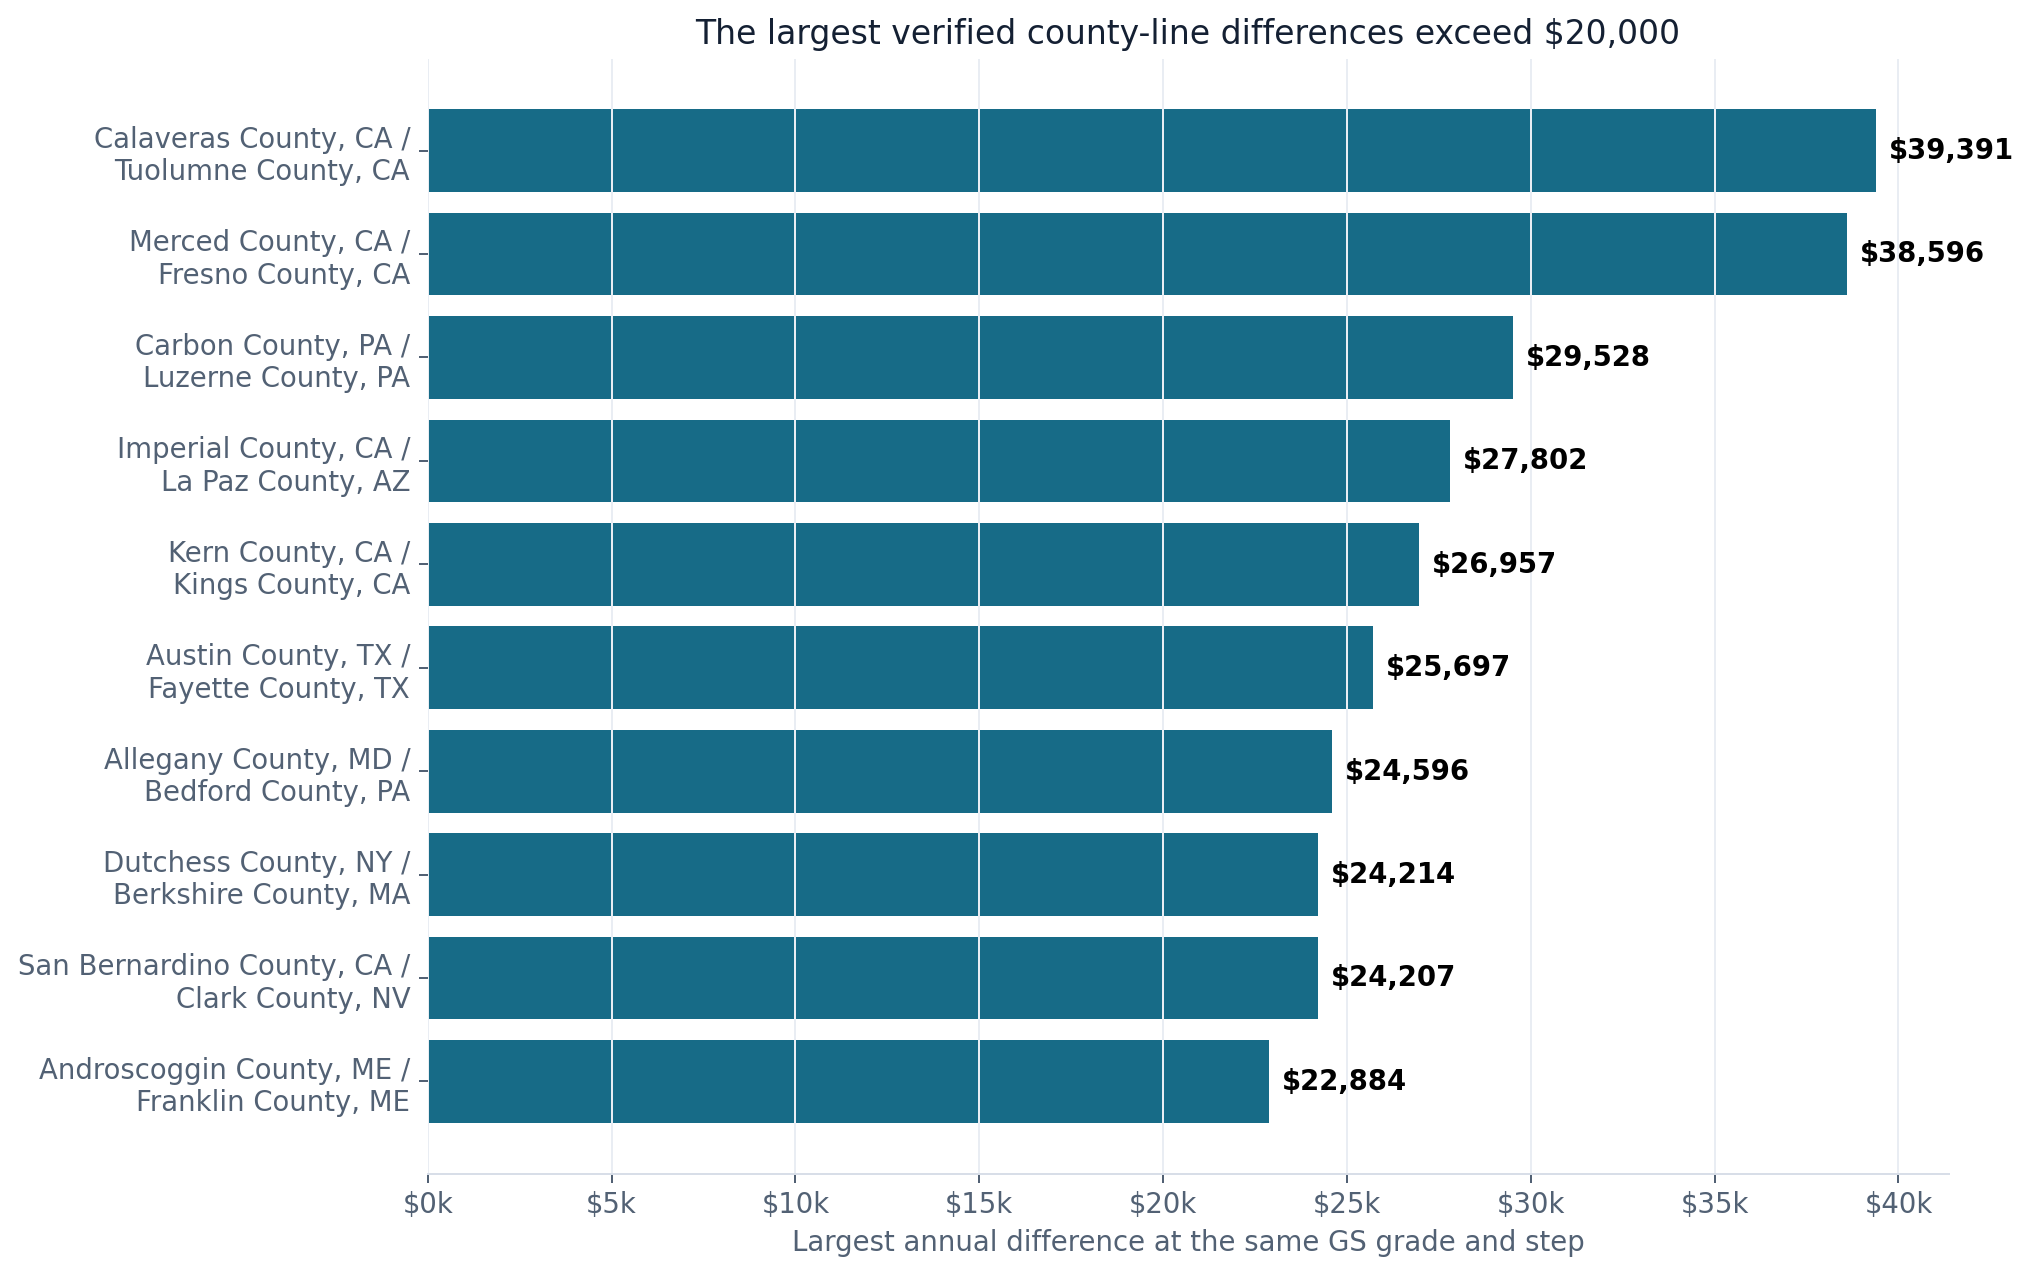
The table below uses one representative adjacent-county pair for each of the eight largest distinct locality-area boundaries. It does not repeat dozens of county edges governed by the same two salary tables.
| Higher-pay county | Lower-pay neighboring county | 2026 locality assignments | GS-12 step 5 salaries | Difference | Largest same-grade/step gap |
|---|---|---|---|---|---|
| Calaveras County, CA | Tuolumne County, CA | San Francisco / Rest of U.S. | $126,817 / $101,443 | $25,374 | $39,391 at GS-15 step 3 |
| Merced County, CA | Fresno County, CA | San Francisco / Fresno | $126,817 / $101,954 | $24,863 | $38,596 at GS-15 step 3 |
| Carbon County, PA | Luzerne County, PA | New York / Rest of U.S. | $119,546 / $101,443 | $18,103 | $29,528 at GS-15 step 5 |
| Imperial County, CA | La Paz County, AZ | Los Angeles / Rest of U.S. | $118,264 / $101,443 | $16,821 | $27,802 at GS-15 step 5 |
| Kern County, CA | Kings County, CA | Los Angeles / Fresno | $118,264 / $101,954 | $16,310 | $26,957 at GS-15 step 5 |
| Austin County, TX | Fayette County, TX | Houston / Rest of U.S. | $116,990 / $101,443 | $15,547 | $25,697 at GS-15 step 5 |
| Dutchess County, NY | Berkshire County, MA | New York / Albany | $119,546 / $104,658 | $14,888 | $24,214 at GS-15 step 5 |
| Allegany County, MD | Bedford County, PA | Washington-Baltimore / Rest of U.S. | $116,071 / $101,443 | $14,628 | $24,596 at GS-15 step 6 |
These are ordinary 2026 GS annual table values. They are not observed paychecks, offers, take-home pay or total compensation. Special salary rates, law-enforcement schedules, the wildland firefighter schedule and non-GS pay systems can produce different results. An announcement that spans several grades can also show a wider range than the single-grade comparisons above.
The Calaveras-Tuolumne split is a recent policy boundary
The present maximum did not exist in this form three years ago. OPM's published county definitions placed Calaveras in Rest of U.S. through 2023. A final rule issued in November 2023 added Calaveras to the San Jose-San Francisco-Oakland locality area for 2024. Tuolumne remained in Rest of U.S.
That rule made broader changes. It established four locality areas centered on Fresno, California; Reno, Nevada; Rochester, New York; and Spokane, Washington. It also modified existing areas of application. OPM estimated that about 33,300 GS employees would be directly affected: roughly 17,100 through modifications to existing areas and 16,200 through the four new areas.
The Calaveras addition is especially consequential because it attached a mostly inland county to one of the highest locality percentages in the country. The line between Calaveras and Tuolumne became both a physical county border and the boundary between the 46.34% San Francisco table and the 17.06% Rest of U.S. table.
It would be tempting to explain the result with home prices or household expenses. That would misstate the system. In the final rule, OPM said locality pay is based on comparing General Schedule and nonfederal salaries for the same levels of work, not on living costs. The rule also said the Pay Agent had no evidence that the changes would create recruitment or retention problems.
That response does not settle whether every boundary produces the desired operational result. It defines what the public record supports. The salary difference is verified. A claim that the line causes a staffing shortage, gives one county unfair treatment or tracks the cost of living would require evidence this analysis does not supply.
Locality areas follow labor-market definitions and commuting evidence
The locality system begins with labor-market geography. OPM says most locality pay areas use metropolitan statistical areas or combined statistical areas. Additional counties can become "areas of application" when federal employment interchange and population criteria show a sufficient connection to the core labor market.
The current criteria illustrate why a county line can matter so much. An adjacent county within a combined statistical area can qualify with an employment-interchange rate of at least 7.5%. A county outside the core area can qualify with a rate of at least 20%, subject to population criteria. Multiple adjacent localities can be evaluated together when their combined interchange reaches the threshold.
Employment interchange measures commuting relationships, not living expenses. It combines the share of employed county residents who work in the core with the share of county employment filled by people who live in the core. OPM and the President's Pay Agent then apply statutory and regulatory rules to define the salary area.
The salary percentages themselves come from a separate comparison. Federal locality-pay law) directs comparisons between General Schedule rates and nonfederal rates for the same levels of work in each locality. The President sets annual adjustments after recommendations from the Pay Agent. The published percentage is therefore a pay-policy result for a defined labor market, not a consumer-price index for a county.
Related research
Put this finding in context
Pay and benefitsAugust 27, 2026
Eight GS-15 Steps Pay the Same in San Francisco. Federal Pay Compression Has Spread to 37 Localities.
FederalHiringData found 21,453 identifiable GS-15 employees in officially capped steps as the 2026 ceiling flattened upper rates in 37 locality tables.

Pay and benefitsAugust 28, 2026
1.64 Million Federal Workers Pay 4.4% Into FERS. The 0.8% Cohort Is No Longer the Majority.
OPM's actuarial counts show the 4.4% FERS-FRAE tier became the majority in 2023, while the same-pay deduction gap reaches $3,600 at $100,000.
This distinction helps explain otherwise surprising boundaries. Carbon County, Pennsylvania, is in the New York locality area while neighboring Luzerne County is Rest of U.S. Imperial County, California, uses the Los Angeles table while neighboring La Paz County, Arizona, is Rest of U.S. Austin County, Texas, uses Houston while neighboring Fayette County does not.
The border analysis found 1,262 adjacent county pairs with different 2026 assignments. Because many edges repeat the same pair of tables, those borders collapse to 101 distinct locality combinations. The count demonstrates how frequently a pay boundary coincides with a county line; it does not count employees who commute across one.
Employees and archived announcements exist on both sides of the line
OPM's June 2026 public employment file provides a limited way to see who works in the counties. It contains 75 covered civilian employees with a Calaveras duty-station county code and 293 in Tuolumne. Of those, 47 and 128, respectively, are coded to the GS pay plan.
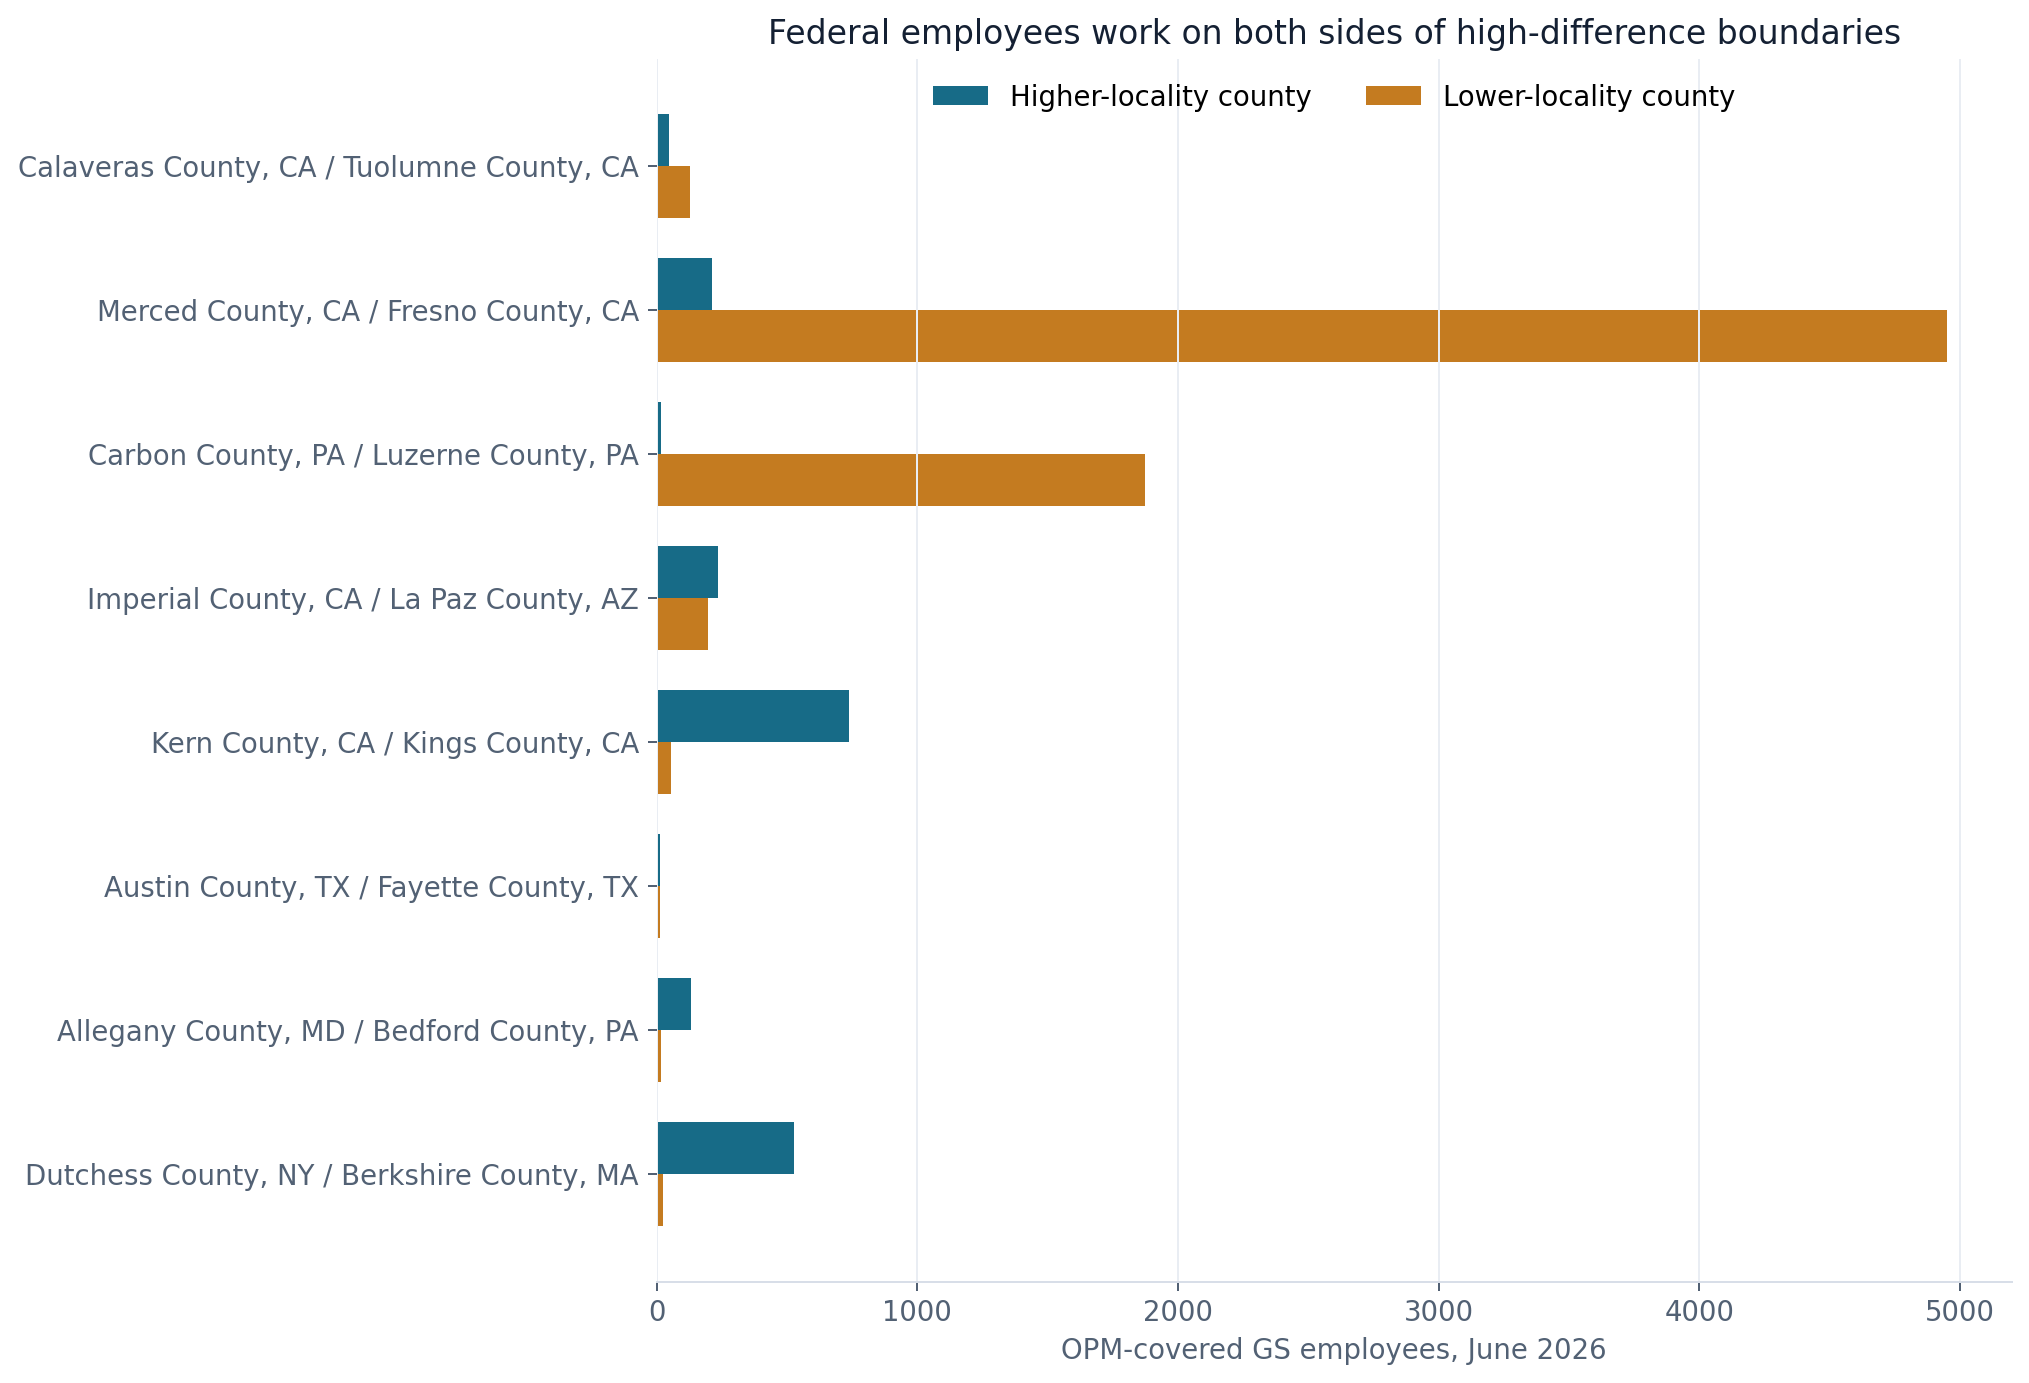
Those numbers are not a complete census of every federal worker. OPM's public files exclude or redact some agencies and records. The all-covered count includes pay plans other than GS, while the narrower bars include only records coded GS. Neither measure tells us whether an individual commutes across the boundary or lives in the same county as the official worksite.
FederalHiringData's historical USAJOBS archive adds another perspective. From March 2017 through Aug. 14, 2026, it contains 124 distinct announcements conservatively mapped to unambiguous places in Calaveras and 1,187 mapped to unambiguous places in Tuolumne. The comparison is not proportional to current headcount, and it should not be read as an application or hiring total.
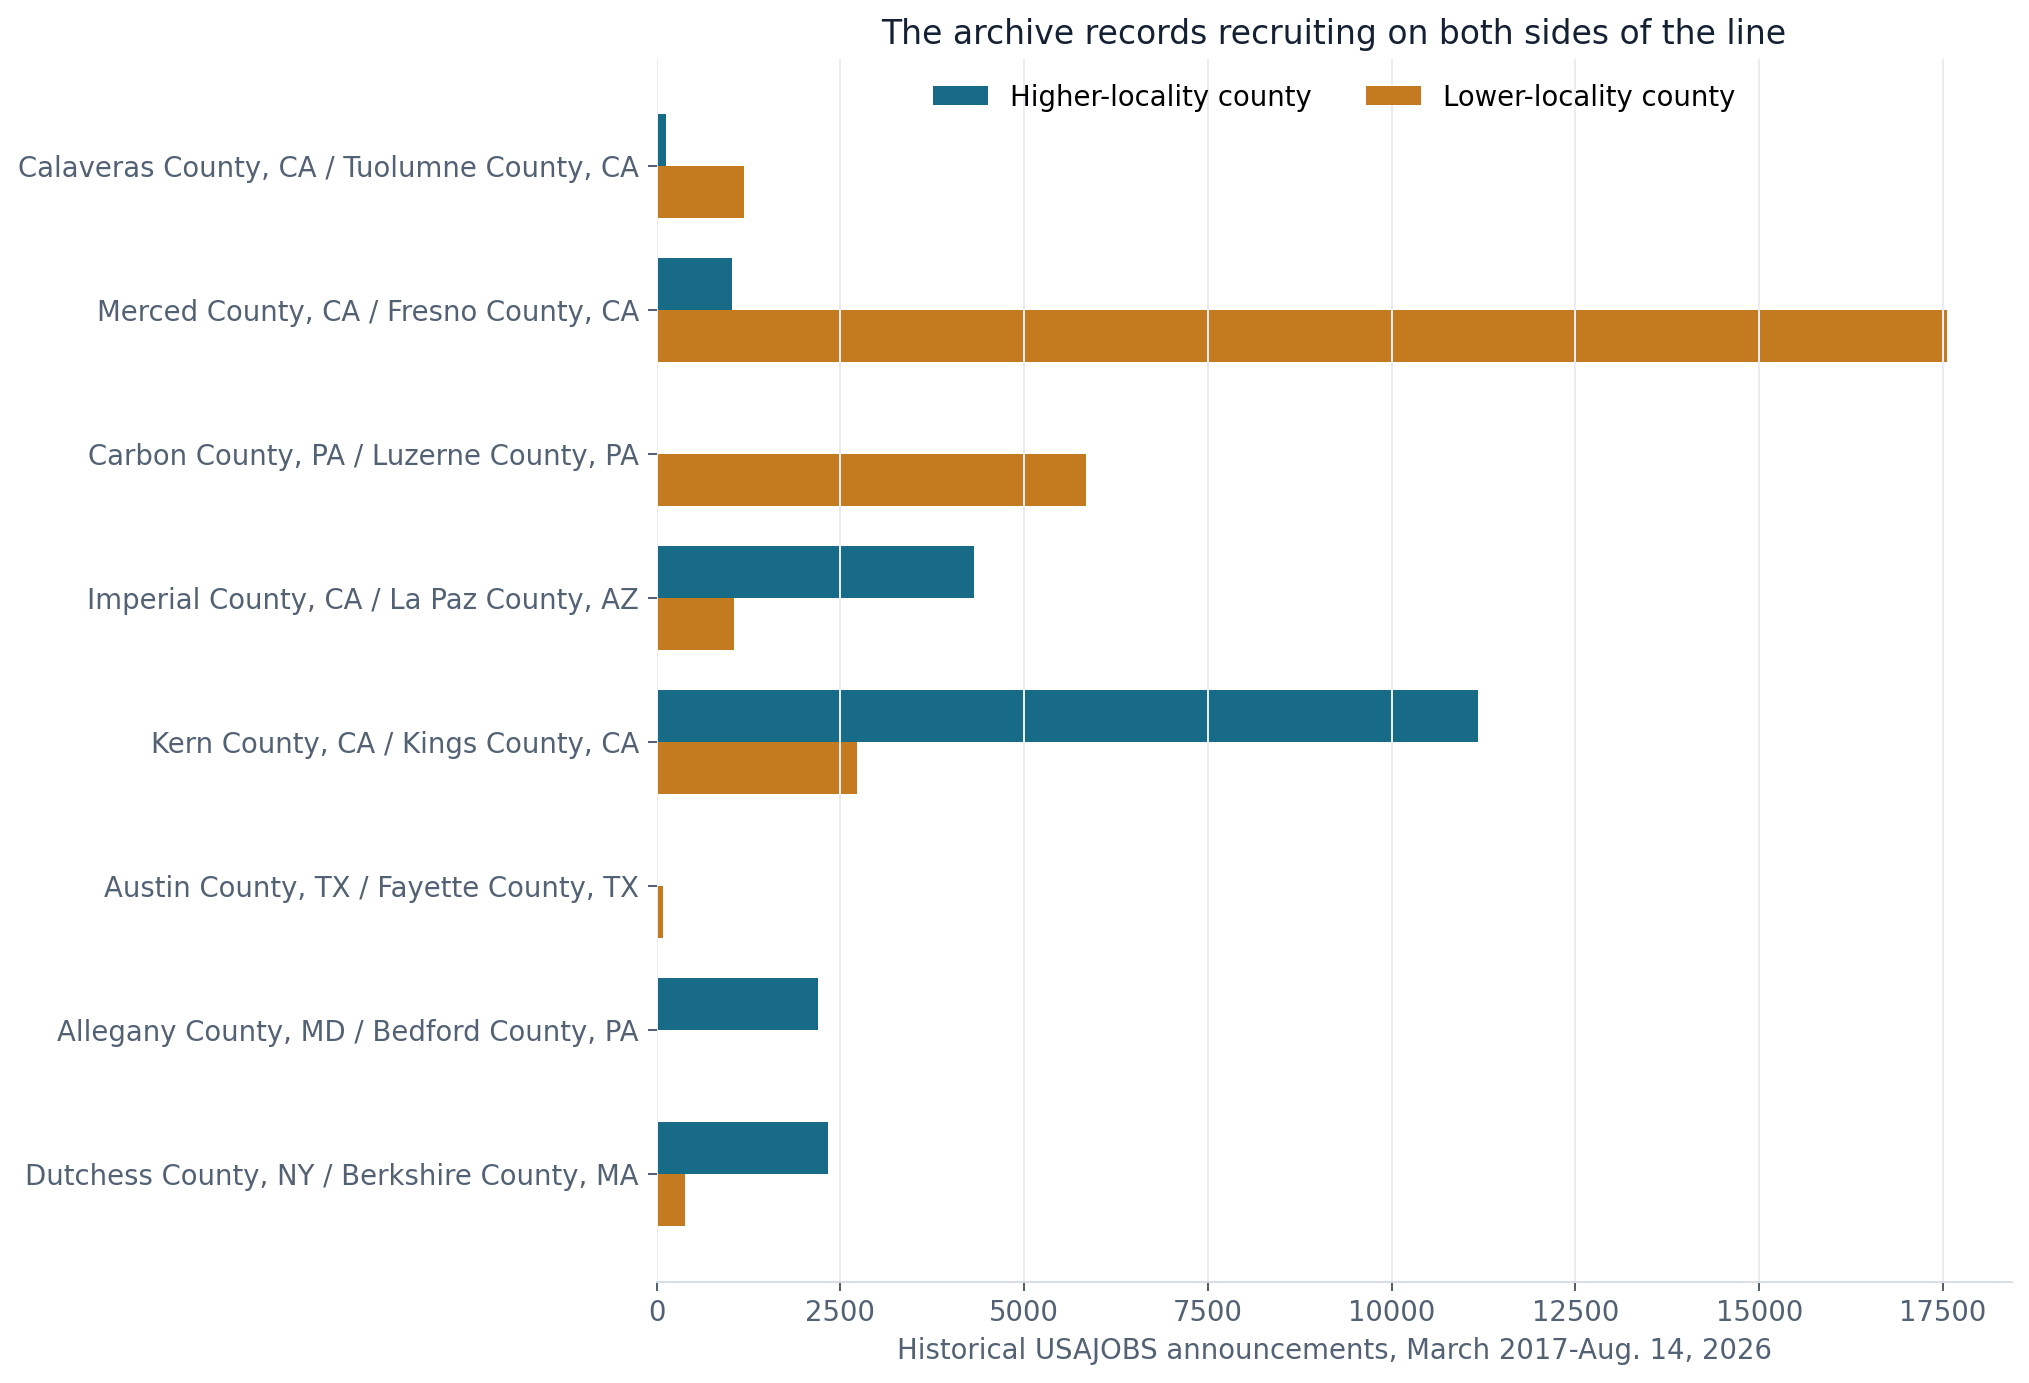
The archive shows why locality assignment is not an abstract payroll footnote. Federal announcements have named duty locations on both sides of these lines. The largest archive totals in the practical set include 22,890 controls mapped to San Bernardino County and 22,085 to neighboring Clark County; 17,557 to Fresno County and 1,032 to Merced; and 11,173 to Kern County and 2,727 to Kings.
Each is a distinct control number within a county, not a distinct vacancy. One announcement can advertise several positions and places. The same control can legitimately count once in each of two counties when it lists locations on both sides. The archive also contains historical closed announcements, so readers looking for positions that are open now should use the current federal jobs search.
The locality map has expanded in large steps
FederalHiringData parsed OPM's county definitions for every year from 2015 through 2026 and applied them to a fixed universe of 3,141 current counties and county equivalents in the 50 states and District of Columbia. Counties assigned to a named locality area increased from 422 in 2015 to 944 in 2026.
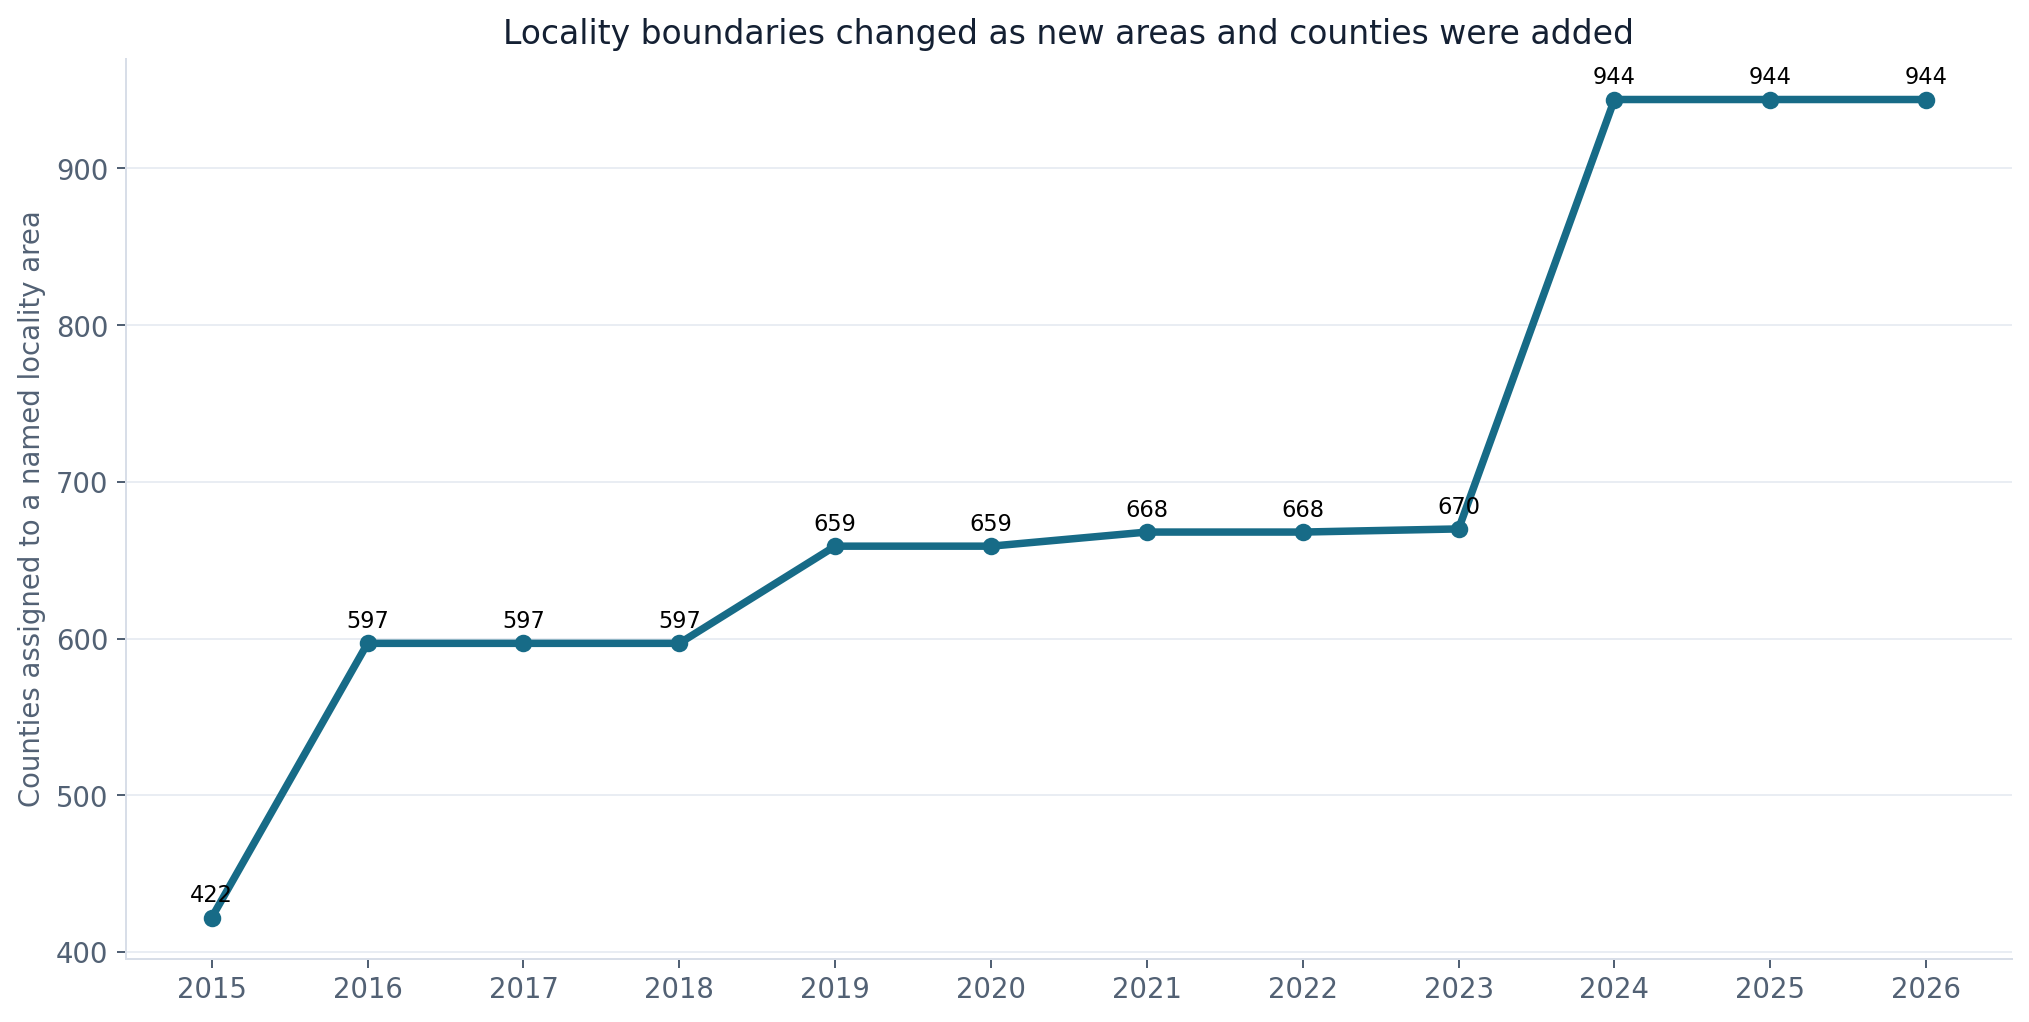
The largest one-year expansion in this series came in 2024, when the count rose from 670 to 944. That is consistent with the four new locality areas and numerous boundary changes in the 2023 final rule. Earlier changes include Carbon County's move from Rest of U.S. into the New York locality in 2016. Fresno County moved from Rest of U.S. into its new Fresno-Madera-Hanford area in 2024, while Merced moved into the San Francisco area.
The chart is a geography count, not an employee count. A sparsely staffed county and a county holding thousands of federal workers each count once. It also uses current county entities as a consistent comparison universe, so obsolete historical county-equivalent codes do not create a false increase.
Boundary expansion can reduce one disparity and create another. Giving Fresno its own table narrowed some differences with nearby counties but left Merced on the higher San Francisco schedule. Adding Calaveras to San Francisco removed its old Rest of U.S. status while creating the current Calaveras-Tuolumne split.
That is not evidence that expansion is inherently good or bad. It shows why a static mental map quickly becomes unreliable. A county's locality assignment can change after regulatory review even when the county itself has not moved.
Federal Hiring Data Weekly
Get the biggest federal workforce changes in your inbox.
Subscribe to Federal Hiring Data Weekly for federal hiring trends, salary data, agency movements, and original investigations, with email confirmation before delivery.
The official worksite, not the home address, controls ordinary locality pay
Locality pay is generally tied to the employee's official worksite, recorded as the duty station on the Standard Form 50. For an employee who regularly reports to an agency worksite, that location ordinarily determines the applicable schedule. Living across a county line does not by itself switch the salary table.
Telework and remote work are not interchangeable. Under OPM's official-worksite guidance, a teleworker who physically reports to the regular agency worksite at least twice each biweekly pay period generally keeps that agency worksite as the official location. Exceptions and temporary arrangements have additional rules.
For a remote employee, the approved alternative worksite can be the official worksite. That may be the employee's residence, but the answer comes from the documented work arrangement and personnel record, not from self-description. Moving a remote worksite across a locality boundary can require agency approval and a duty-station change.
Applicants should therefore read the location and pay sections of an announcement together. A position described as location negotiable may not have a final locality rate until the duty station is established. A multi-location announcement can display a broad salary range covering several tables. A remote-eligible position and a telework-eligible position can reach different worksite outcomes.
The same caution applies to employees comparing reassignment options. A nearby office may use another locality table. An office address in a familiar metro name may sit in a county with a different formal assignment. The authoritative checks are OPM's current locality definitions and the exact salary table associated with the official duty station.
Salary caps change the gap near the top of the schedule
The 2026 locality percentages represented by the leading county boundaries range from Rest of U.S. at 17.06% to San Francisco at 46.34%. Applying those percentages does not produce an unlimited spread at every grade and step.
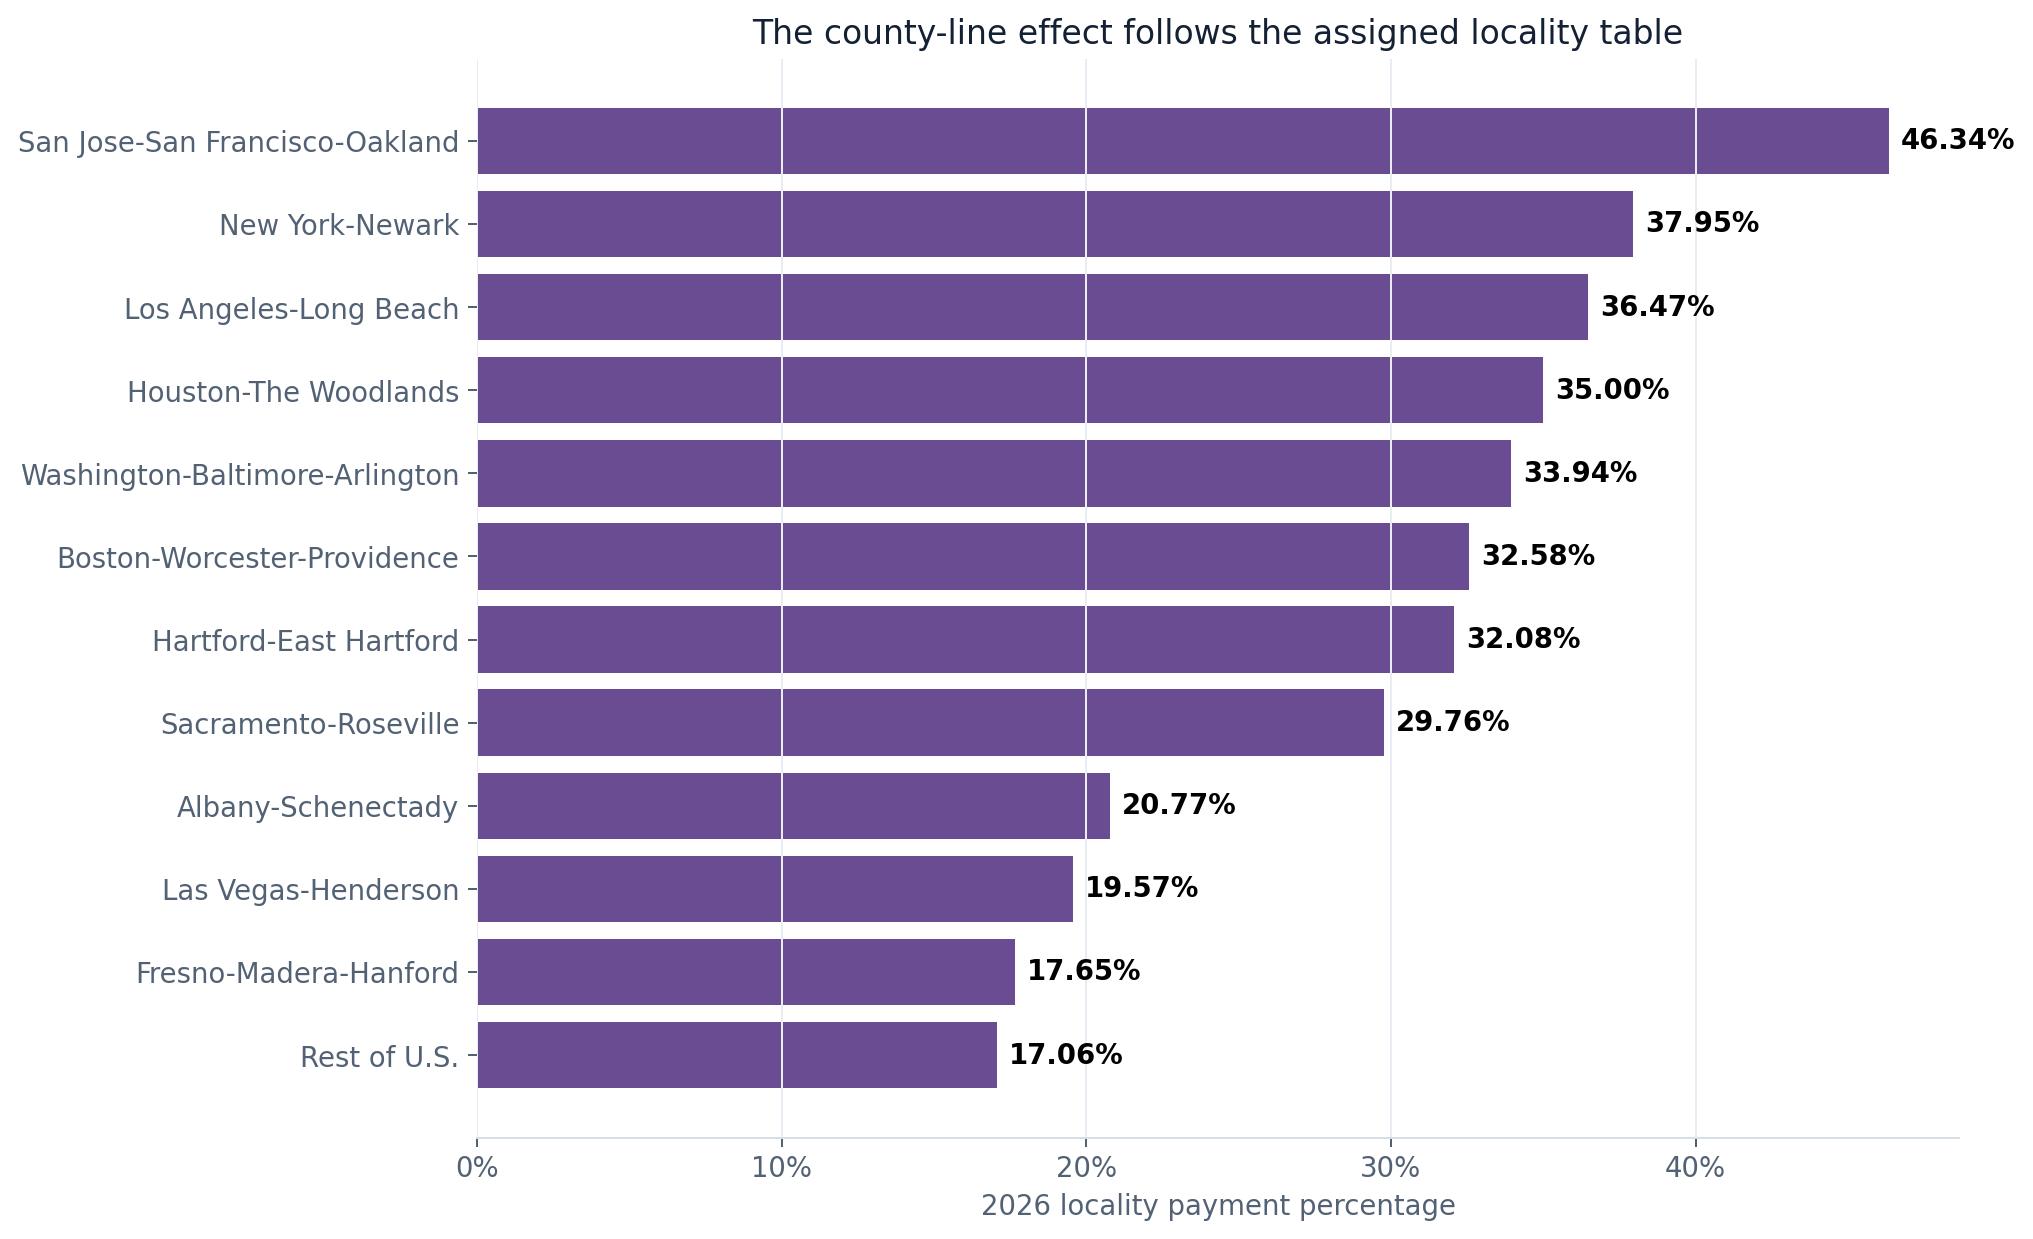
At GS-15 step 3, the San Francisco table reaches $197,200 while Rest of U.S. is $157,809, producing the $39,391 maximum. At later San Francisco steps, the statutory salary cap holds the published rate at $197,200 while the Rest of U.S. table continues rising. The difference therefore narrows.
That pattern is pay compression, but it is not the thesis of this investigation. FederalHiringData has separately examined the GS-15 salary cap and pay compression. Here, the cap matters because a simplistic calculation that multiplies every base rate by each locality percentage would overstate some official salaries and could identify the wrong maximum.
FederalHiringData retained the values OPM actually published for all 15 grades and 10 steps. It did not recalculate capped cells. The $39,391 figure is the largest difference found between matching cells on the official 2026 tables associated with physically adjacent counties.
Comparing two federal jobs requires more than matching the grade
A useful comparison starts with the basics: Is each job on the ordinary GS table? What grade and step is being compared? What is the official worksite? Which 2026 locality definition contains that county? Does a special rate apply? Is the announcement showing one location or the full span across several?
The county boundary table can identify where large scheduled differences are possible, but it cannot predict an individual's offer. New federal employees often enter at step 1 unless an agency approves a higher step under an applicable authority. Current employees can have different steps, retained pay or promotion calculations. Benefits, deductions and state taxes are outside the table comparison.
Nor can a salary difference be converted into a claim about recruitment. The OPM data establish that covered employees work on both sides. The USAJOBS archive establishes that agencies have advertised positions on both sides. Neither reveals how many qualified applicants agencies received, how many offers were accepted, whether jobs remained vacant or whether locality pay caused any outcome.
For that reason, the right use of this analysis is verification. It flags adjacent places where the phrase "same grade" is not enough. It does not rank the counties as good or bad duty stations and does not recommend moving for a table rate.
Methodology and limitations
FederalHiringData downloaded OPM's official 2026 General Schedule XML tables and parsed every annual salary cell for grades 1 through 15 and steps 1 through 10. It parsed OPM's county-level locality definitions for 2015 through 2026. Alaska and Hawaii were assigned through their statewide locality definitions; counties not named in another area were assigned to Rest of U.S.
The county edges come from the Census Bureau's 2025 County Adjacency File. Self-links and reverse duplicates were removed, leaving one record per adjacent pair. Census adjacency can include counties that meet at a point. The national boundary total therefore follows the Census definition; the article's practical examples emphasize well-defined locality pairings rather than asserting a particular commuting route crosses every edge.
For each pair with different locality codes, the analysis compared the same grade and step on both official schedules. The representative measure is GS-12 step 5. The maximum measure is the largest published-dollar difference among all matching cells. It is scheduled annual pay, not payroll, net income, total compensation, a special rate or an offer.
OPM employment counts come from the June 2026 Federal Workforce Data employment file. County FIPS was constructed from the published duty-station state and county codes. Covered headcount sums OPM's count field; GS headcount is restricted to pay-plan code GS. Public OPM data omit or redact some records and do not cover every federal entity.
Historical announcement counts use FederalHiringData's USAJOBS archive from March 2017 through Aug. 14, 2026. Exact normalized city and state names were matched to the Census Bureau's 2020 national place-by-county file. Places spanning more than one county were excluded, as were unmatched names. The method is conservative: across the selected boundary states, 98,324 candidate location rows matched selected counties; 188,126 multi-county rows were excluded, 288,633 did not match a Census place, and 1,059,528 mapped outside the selected boundary counties.
Announcement counts are distinct control numbers within a county. They are not vacancies, applications, referrals, interviews, selections or hires. A control listing places in two counties can appear in both county counts. The archive is historical and does not establish current availability.
The historical coverage series applies each year's OPM definitions to a fixed universe of 3,141 current counties and county equivalents. Its 422-to-944 change measures named-locality geography, not workers receiving locality pay. Obsolete historical entities are excluded. Regulatory definitions and salary tables can change in future years.
The complete analysis was produced without OpenAI API calls. The article's map and charts are original FederalHiringData visualizations derived from OPM and Census public data. Core sources include OPM's 2026 salary tables, 2026 locality definitions, locality-pay guidance and the Census adjacency and place files.
Read the duty station before treating nearby jobs as equivalent
Calaveras and Tuolumne are neighbors. Their 2026 GS schedules are not. The same is true across more than a thousand county edges, with differences shaped by labor-market definitions, regulatory choices and the limits built into the salary schedule.
The line can move. Calaveras changed assignments in 2024. Fresno received a new locality area. Other counties have entered existing areas as commuting definitions and policy decisions evolved. A comparison based on last year's map can therefore be wrong even when the grade and office have not changed.
For a candidate, the practical sequence is simple: confirm the duty location, identify the formal locality area, open the matching OPM table, and check whether the announcement uses an ordinary or special schedule. For an employee considering a worksite change, confirm how the agency will record the official duty station before calculating the pay effect.
County lines are easy to overlook on a regional map. In federal pay administration, they can be worth tens of thousands of scheduled dollars.
Related research
More from FederalHiringData
Pay and benefitsAugust 27, 2026
The Median FEHB Family Increase Took 94% of a Rest-of-U.S. GS-7 Raise
OPM plan-level rates show the median 2026 family premium increase absorbed 94% of one Rest-of-U.S. GS-7 step 5 scheduled raise.
Pay and benefitsAugust 27, 2026
One in Four USAJOBS Announcements Outside Urban Areas Advertised a Hiring Incentive
FederalHiringData found incentive language in 26.43% of exact-location postings outside Census urban areas, versus 17.57% inside them.
Pay and benefitsAugust 27, 2026
The TSP Now Lets Ages 60-63 Save $35,750. FERS Savers Ages 60-69 Averaged 10.8%.
The TSP raised contribution ceilings and added Roth rules in 2026, but FRTIB and OPM data show why the changes reach federal savers unevenly.
Federal Hiring Data Weekly
Get the biggest federal workforce changes in your inbox.
Subscribe to Federal Hiring Data Weekly for federal hiring trends, salary data, agency movements, and original investigations, with email confirmation before delivery.