August 28, 2026
1.64 Million Federal Workers Pay 4.4% Into FERS. The 0.8% Cohort Is No Longer the Majority.
OPM's actuarial counts show the 4.4% FERS-FRAE tier became the majority in 2023, while the same-pay deduction gap reaches $3,600 at $100,000.
Published August 28, 2026Last edited August 28, 2026

The federal pension deduction on two employees' pay statements can differ by thousands of dollars even when they earn the same salary and are working toward the same ordinary FERS annuity formula.
At $100,000 in basic pay, a regular Federal Employees Retirement System participant contributes $800 a year toward the basic benefit. A FERS-Revised Annuity Employee contributes $3,100. A FERS-Further Revised Annuity Employee contributes $4,400. The difference between the first and third worker is $3,600 every year at that salary.
That is no longer a comparison between a large established workforce and a small group of newcomers. The Office of Personnel Management's latest detailed actuarial valuation counted 1,642,000 FERS-FRAE full-time-equivalent participants as of Sept. 30, 2024. The original regular FERS group had fallen to 1,261,700. FRAE, the 4.4% cohort, represented 55.4% of all FERS participants in the valuation.
The crossover happened in 2023. It changes the practical meaning of a policy often explained as a higher deduction for employees hired after 2013: the newer rate now applies to the majority of the FERS population measured by OPM.
FederalHiringData reviewed four annual Civil Service Retirement and Disability Fund valuations, the laws that created the newer tiers, OPM coverage guidance and the public federal workforce files. The official record can answer how many participants sit in each regime. It cannot support assigning an individual employee's rate from a hire date alone, or breaking every agency's workforce into those cohorts from the public file.
The 4.4% cohort is now the largest
OPM's Sept. 30, 2024 valuation counted 2,966,200 FERS full-time-equivalent participants. The total includes the Postal Service and groups that are not fully represented in public OPM employment downloads. It is broader than the roughly two-million-person civilian workforce measure often used on public dashboards.
| Retirement coverage | Most regular employees contribute | 2024 FTE participants | Share of all FERS FTEs |
|---|---|---|---|
| FERS-FRAE | 4.4% | 1,642,000 | 55.4% |
| Regular FERS | 0.8% | 1,261,700 | 42.5% |
| FERS-RAE | 3.1% | 59,500 | 2.0% |
| FERS-Elect | Coverage-specific | 3,000 | 0.1% |
| FERS total | — | 2,966,200 | 100.0% |

Those are actuarial full-time equivalents, not a roster of named employees. Part-time schedules and actuarial controls can make FTEs differ from headcount. OPM says it builds the active population from its Enterprise Human Resources Integration statistical data and Postal Service records, then controls it to accounting records of employee withholdings and agency contributions. That process also represents participants absent from the public employment file, including some Legislative and Judicial branch workers and security-sensitive executive-branch employees.
The 59,500-person RAE group is small for a straightforward reason: it is largely a one-year entry cohort. RAE generally covers employees who entered during calendar 2013 and did not qualify for an exception. FRAE generally covers entrants beginning in 2014. Regular FERS includes most participants who entered before 2013 as well as later employees whose prior covered service preserved the older tier.
“Generally” is essential. The laws ask more than the date on a current appointment. Prior covered service, whether the person was covered or performing creditable service on a statutory date, breaks in service and other facts can preserve an earlier plan. An employee rehired in 2026 can still be regular FERS. Another employee hired in 2014 can be FRAE. Hire year is a useful population story, not an individual benefits determination.
Four valuations show the cohort turnover
In OPM's valuation for Sept. 30, 2021, regular FERS still accounted for 1,536,600 FTE participants, or 55.1% of the FERS total. FRAE accounted for 1,174,600, or 42.1%. By 2023 the relationship had reversed: 1,488,300 FRAE participants versus 1,342,500 regular FERS.

From 2021 to 2024, the FRAE population increased by 467,400 FTEs, or 39.8%. Regular FERS declined by 274,900, or 17.9%. RAE declined by 11,700, or 16.4%. The total FERS population increased by 178,200, or 6.4%.
| Sept. 30 valuation | Regular FERS | FERS-RAE | FERS-FRAE | FERS-Elect | FERS total |
|---|---|---|---|---|---|
| 2021 | 1,536,600 | 71,200 | 1,174,600 | 5,600 | 2,788,000 |
| 2022 | 1,433,800 | 67,400 | 1,299,100 | 4,500 | 2,804,800 |
| 2023 | 1,342,500 | 62,200 | 1,488,300 | 3,700 | 2,896,700 |
| 2024 | 1,261,700 | 59,500 | 1,642,000 | 3,000 | 2,966,200 |
The direction is structural even though year-to-year workforce events matter. New FRAE-covered entrants add to that group while retirements and separations remove participants from every cohort. The original FERS population can also receive returning workers whose previous service protects regular coverage. The annual reports do not publish a transition matrix showing precisely which flow produced each change.
The shift does not prove that 55.4% of every agency is FRAE. Agencies have different age, tenure, hiring and occupational profiles. Nor does it mean 55.4% of every employee headcount file pays exactly 4.4%. Special-provision employees generally contribute an additional 0.5 percentage point, and other retirement systems remain in the government.
What Congress changed in 2012 and 2013
The Middle Class Tax Relief and Job Creation Act of 2012 created the revised annuity employee definition. For most regular employees who became covered after Dec. 31, 2012 and lacked the statutory prior-service protection, the employee contribution rose from 0.8% to 3.1%.
The Bipartisan Budget Act of 2013 created further revised annuity employees. For most regular employees entering after Dec. 31, 2013 without an exception, the rate became 4.4%.
The laws did not simply say everyone hired in a particular year must pay a particular percentage forever. The RAE definition looks at whether the individual was covered or performing creditable civilian service on Dec. 31, 2012 and whether the individual had at least five years of creditable civilian service. FRAE uses a related Dec. 31, 2013 test and preserves coverage for some people with prior service.
OPM's RAE coverage guidance and FRAE determination guidance walk agencies through cases where the current appointment date produces the wrong answer. A returning employee with five years of earlier creditable service may stay under regular FERS. A worker who had less prior service and was not covered on the relevant date may enter a newer tier.
The practical source is the employee's retirement-plan code, normally documented on the SF-50. OPM's coverage handbook says traditional FERS codes include K, L, M, N and O; RAE codes generally add an R, such as KR; FRAE codes add an F, such as KF. The exact code also distinguishes regular employees from law-enforcement officers, firefighters, air-traffic controllers, military reserve technicians and other special groups.
That is why FederalHiringData did not estimate cohort membership from service-computation dates in the public workforce file. OPM's current Federal Workforce Data employment download does not publish retirement-plan code. A service date also can include time that does not answer the statutory coverage test. An attractive agency-by-agency chart built from hire year would be precise-looking and wrong.
The same ordinary formula can carry very different employee prices
OPM states that, for most employees, there is no difference in the FERS basic benefit paid under regular FERS, RAE and FRAE. The ordinary formula generally starts with 1% of the high-three average salary multiplied by years of creditable service. For an employee retiring at age 62 or older with at least 20 years, the multiplier generally becomes 1.1%.
That distinction matters because FERS is a defined-benefit pension, not an individual account whose final value is simply the worker's deposits plus investment returns. The basic annuity is calculated under the statutory formula. Employee deductions flow into the Civil Service Retirement and Disability Fund, while the government makes agency contributions under rates OPM establishes for plan funding. The 0.8%, 3.1% and 4.4% labels therefore describe what covered employees contribute from basic pay; they do not describe three proportional benefit multipliers.
This also separates the pension comparison from the other two major parts of FERS. Social Security coverage follows its own payroll-tax and benefit rules. The Thrift Savings Plan is the account-based component, where employee contributions, agency automatic contributions, matching and investment performance affect the balance. A worker paying 4.4% toward the FERS basic benefit can still make the same TSP contribution elections as a similarly situated worker paying 0.8%. Looking only at one deduction line can miss the structure of the full retirement package, but it remains a material difference in annual take-home pay.
That does not mean every federal retirement calculation is identical. Law-enforcement officers, firefighters, air-traffic controllers, Members of Congress, congressional employees and other categories can have special rules. Age, service, survivor elections, part-time work, deposits, refunds and the timing of retirement matter. This article compares the standard contribution tiers, not an individual's annuity estimate.
For a regular employee, the rate arithmetic is direct:
| Annual basic pay | Regular FERS 0.8% | FERS-RAE 3.1% | FERS-FRAE 4.4% | FRAE minus regular |
|---|---|---|---|---|
| $50,000 | $400 | $1,550 | $2,200 | $1,800 |
| $75,000 | $600 | $2,325 | $3,300 | $2,700 |
| $100,000 | $800 | $3,100 | $4,400 | $3,600 |
| $125,000 | $1,000 | $3,875 | $5,500 | $4,500 |
| $150,000 | $1,200 | $4,650 | $6,600 | $5,400 |
| $200,000 | $1,600 | $6,200 | $8,800 | $7,200 |

Federal Hiring Data Weekly
Get the biggest federal workforce changes in your inbox.
Subscribe to Federal Hiring Data Weekly for federal hiring trends, salary data, agency movements, and original investigations, with email confirmation before delivery.
The RAE premium over regular FERS is 2.3 percentage points. The FRAE premium is 3.6 points. Unlike a flat premium, the dollar difference expands with basic pay.

These are gross payroll deductions for the FERS basic benefit. They are not the worker's total retirement saving and should not be added to take-home pay calculations without accounting for taxes and other deductions. Social Security is a separate FERS tier. The Thrift Savings Plan is separate too, with employee deferrals, automatic agency contributions and matching subject to its own rules.
Agency contributions also differ by tier and fiscal year. A higher employee rate does not mean an employee receives the difference in a personal investment account. Contributions finance the Civil Service Retirement and Disability Fund under the statutory funding system. A worker who leaves may have refund or service-credit choices, but those choices can affect future benefits and require individual guidance.
A $6.08 billion illustration—with a large warning label
The size of the FRAE population makes the aggregate difference substantial. But OPM's public actuarial table does not report a separate average salary for regular FERS, RAE and FRAE. It reports an all-FERS average of $100,488 in the Sept. 30, 2024 population table.
FederalHiringData therefore calculated a bounded illustration, not a payroll estimate. If every RAE and FRAE FTE earned that same $100,488 average, their employee contributions above the regular 0.8% rate would total about $6.08 billion a year: approximately $137 million for RAE and $5.94 billion for FRAE.
The calculation is useful for scale and unsuitable for accounting. The cohorts almost certainly have different salary distributions. Newer workers tend to have shorter service, but prior-service exceptions break a simple equivalence between tenure and coverage. Special-provision rates add another 0.5 point. FTEs are not headcount, and payroll changes throughout a year.
The actual weighted average employee-contribution rate across the three standard cohorts would be about 2.84% if every cohort had identical payroll per FTE. OPM's actuarial cash-flow table reports employee contributions as a percentage of total FERS payroll using actual plan accounting and broader assumptions; it should be used for trust-fund analysis. The $6.08 billion figure should not replace it.
Tenure shows why the change will persist
OPM's combined FERS population table provides age and service distributions but not contribution tier by either variable. As of Sept. 30, 2024, 885,077 FERS FTE participants had fewer than five years of service. Another 625,436 had five through nine years. Together, those groups were just over half of the FERS population.

That distribution is consistent with a large post-2013 cohort, but it is not a tier assignment. Someone with fewer than five years in a current agency may have older creditable federal service. Someone with long total service may have entered during the FRAE era through a covered path. OPM's official plan counts, not tenure bins, establish the regime totals.
The combined table also shows that the average salary rises from $78,279 among FERS participants with fewer than five years to $111,640 among those with 10 through 14 years and $121,086 among those with at least 30. That pattern is another reason the equal-salary aggregate illustration cannot be treated as actual deductions by cohort.
For an individual, even a constant-pay illustration accumulates quickly. At an unchanged $100,000 salary, the FRAE employee would contribute $36,000 more than a regular FERS employee over 10 years and $108,000 more over 30 years. RAE would contribute $23,000 more over 10 years and $69,000 more over 30.

Real careers do not hold pay constant for 30 years. Promotions, locality changes, part-time schedules, unpaid leave and statutory pay adjustments change deductions. The chart does not apply investment returns, inflation, taxes or the time value of money. It is arithmetic that isolates the contribution-rate difference, not a forecast of retirement wealth.
Related research
Put this finding in context

Pay and benefitsAugust 28, 2026
55,135 Federal Retirement Actions in 2025 Were Below Age 60. That Is Not a FERS Supplement Count.
OPM records show a 2025 retirement surge below age 60, but age alone cannot identify who receives the FERS annuity supplement.

Pay and benefitsAugust 27, 2026
Eight GS-15 Steps Pay the Same in San Francisco. Federal Pay Compression Has Spread to 37 Localities.
FederalHiringData found 21,453 identifiable GS-15 employees in officially capped steps as the 2026 ceiling flattened upper rates in 37 locality tables.
What employees should verify
The first question is not “What year was I hired?” It is “What retirement plan code is on my SF-50, and is it correct given my service history?” An employee with prior service should review the coverage determination with the agency benefits office before assuming that a payroll percentage proves the right category.
The second question is what pay is subject to retirement deductions. OPM generally defines basic pay for retirement purposes, not every dollar on a pay statement. Overtime and many premium payments are excluded, while some fixed supplements can count. Multiplying gross compensation by 4.4% can therefore overstate or understate the actual deduction base.
The third question is which comparison matters. The 0.8%, 3.1% and 4.4% rates cover the FERS basic benefit. They do not replace Social Security withholding, TSP contributions, health insurance, life insurance or taxes. A newer employee can still receive agency TSP automatic and matching contributions under the separate TSP rules. Calling the FERS deduction a complete “retirement contribution rate” blurs distinct programs.
Employees considering a refund after leaving should also understand the consequence for service credit. OPM says a refund of FERS retirement deductions is allowed, and refunded service may require a redeposit after reemployment to count fully toward an annuity. The answer depends on service dates and current law. This is a benefits-office or retirement-counselor question, not a shortcut calculation from an online post.
The intergenerational gap is now the system's center
The public discussion often frames 4.4% as the price paid by “new” federal employees. OPM's own participant counts show why that wording is aging badly. The FRAE tier is 12 years old in 2026, and its 1.64 million FTE participants already outnumber regular FERS by roughly 380,000 in the latest valuation.
The difference is not that newer employees receive five-and-a-half times the ordinary annuity formula. For most participants, OPM says the basic benefit is the same. The difference is that 4.4% is five-and-a-half times the 0.8% employee rate. At equal basic pay, the newer worker sends an additional 3.6% of salary to the pension fund each year.
Congress created that difference in two steps, and prior-service protections kept the boundaries more complicated than three hiring dates. The most defensible answer is therefore both simple and qualified: OPM counted 55.4% of FERS participants in FRAE in 2024, but only the official coverage record can say which rate belongs to an individual.
The cohort turnover is still moving. Regular FERS lost nearly 275,000 FTE participants from the 2021 to 2024 valuations while FRAE gained more than 467,000. Barring another statutory change or a major break in the flow of entrants and exits, the 4.4% group will become still more dominant as the original cohort retires.
That makes the contribution gap more than a historical footnote. It is now the standard experience for most FERS participants—and one of the largest recurring differences between federal employees doing comparable work at comparable pay.
Methodology and limitations
FederalHiringData transcribed full-time-equivalent active participant counts from OPM's fiscal 2022 through fiscal 2025 Civil Service Retirement and Disability Fund annual reports. The snapshots correspond to Sept. 30, 2021 through Sept. 30, 2024. Shares use each report's FERS total, including FERS-Elect. Changes are FederalHiringData calculations from those official counts.
The participant denominator is broader than OPM Federal Workforce Data employment headcount. It includes Postal Service participants and uses accounting controls to represent participants absent from public EHRI records. FTEs are not unique people. The latest detailed cohort valuation available for this analysis is Sept. 30, 2024, not a live 2026 payroll count.
Rates and coverage rules come from OPM's CSRS/FERS Handbook, Chapter 10 coverage guidance, Benefits Administration Letters 12-104 and 14-107, and Public Laws 112-96 and 113-67. Rates shown in salary tables are for most regular employees. Special groups generally contribute 0.5 percentage point more.
The public OPM employment file does not expose retirement-plan code, so FederalHiringData did not classify employees by agency, occupation, age, salary or hire date. The all-FERS service and salary table is contextual only. The $6.08 billion figure assumes every RAE and FRAE FTE earns the all-FERS average salary of $100,488 and compares their stated rates with 0.8%; it is an illustration, not actual payroll, trust-fund revenue or a cost estimate.
Salary examples use basic pay multiplied by the stated employee rate. They exclude Social Security, TSP, taxes and other deductions. Cumulative examples hold pay constant and ignore inflation, raises, interest and time value. They are not financial or retirement advice.
The topic was selected partly because a r/fednews discussion about the three rates drew about 269 points. Reddit supplied an audience-demand signal only. No post, vote or comment was used as evidence for a cohort count, legal rule or financial result.
The downloadable summary data contains the annual cohort counts and salary illustrations used in the charts.
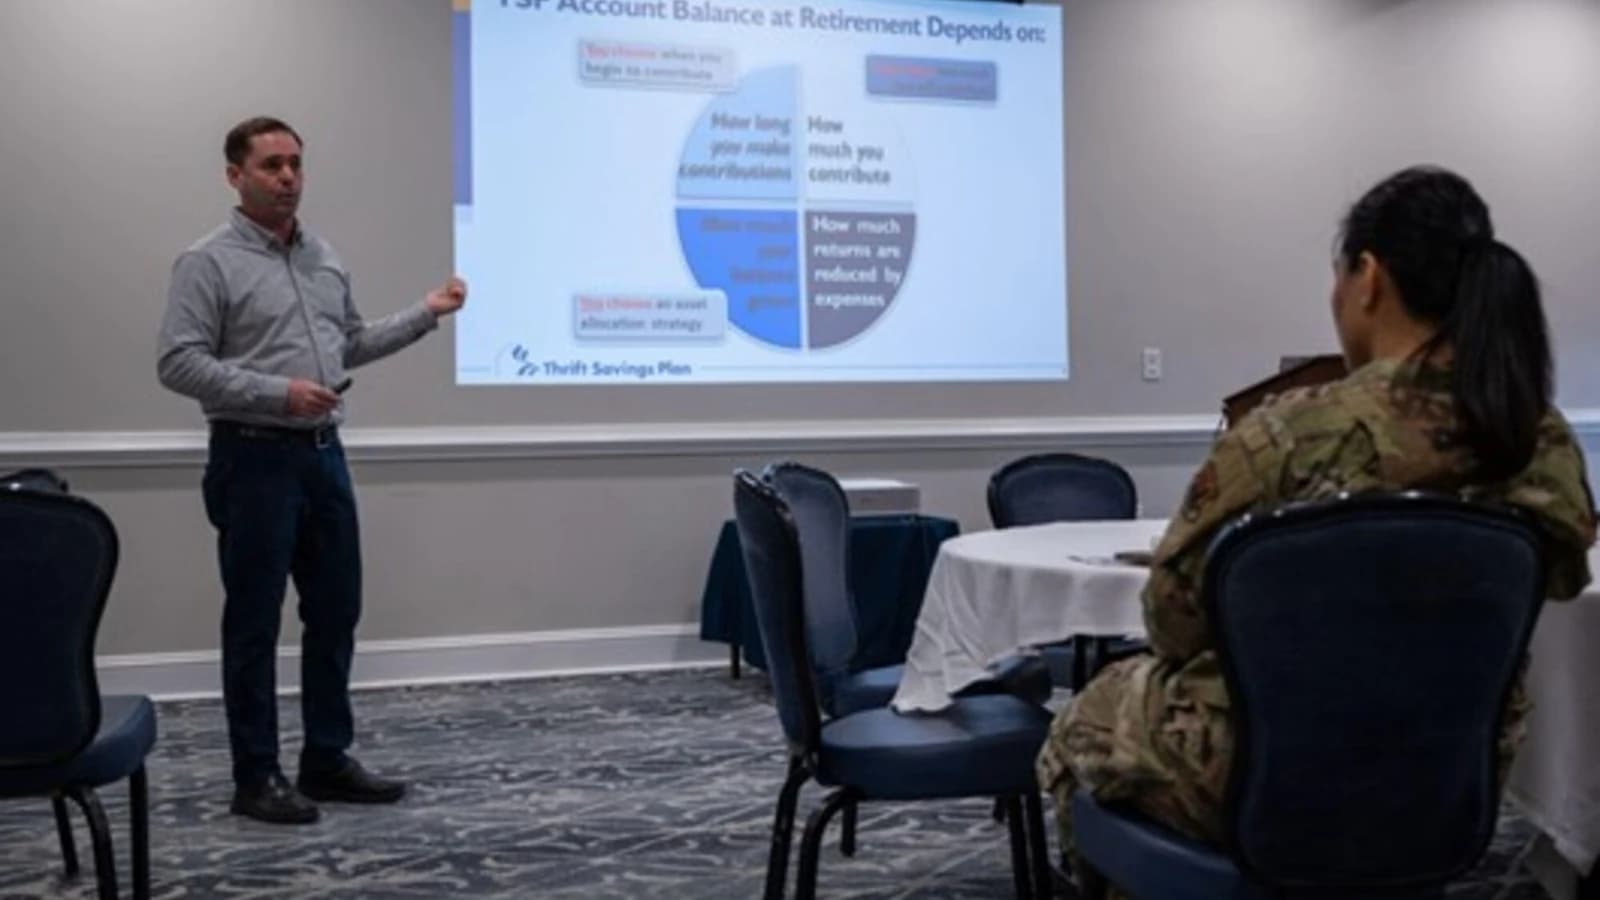
Photo: Angel D. Martinez-Navedo, U.S. Army, via DVIDS, public domain.
Continue reading
More from FederalHiringData
Pay and benefitsAugust 27, 2026
The TSP Now Lets Ages 60-63 Save $35,750. FERS Savers Ages 60-69 Averaged 10.8%.
The TSP raised contribution ceilings and added Roth rules in 2026, but FRTIB and OPM data show why the changes reach federal savers unevenly.

Pay and benefitsAugust 19, 2026
Federal Pay Rose 14%. Prices Rose Nearly Twice as Fast.
Consumer prices rose 27.7% from January 2021 through July 2026 while the GS base schedule rose 14.4%. Locality pay narrowed, but did not erase, the loss in scheduled purchasing power.

Data investigationsAugust 25, 2026
The Wage and Hour Division Has 883 Investigators for 155 Million Workers. Its Newer-Tenure Bench Collapsed.
Wage and Hour retained consequential enforcement results as investigator ranks fell 36% from their 2012 peak and its newer-tenure bench thinned sharply.
Federal Hiring Data Weekly
Get the biggest federal workforce changes in your inbox.
Subscribe to Federal Hiring Data Weekly for federal hiring trends, salary data, agency movements, and original investigations, with email confirmation before delivery.