August 23, 2026
USCIS Had 12.1 Million Cases Pending. Its Formal Backlog Was 7 Million.
Receipts exceeded completions by 929,000 in the first half of fiscal 2026 as covered employment remained 11% below its January 2025 peak.
By Evan Mercer
Published August 23, 2026Last edited August 23, 2026
U.S. Citizenship and Immigration Services had 12.13 million applications and petitions pending on March 31, 2026. Its formal net backlog was much smaller: about 7.03 million.
Both numbers are large. They do not mean the same thing.
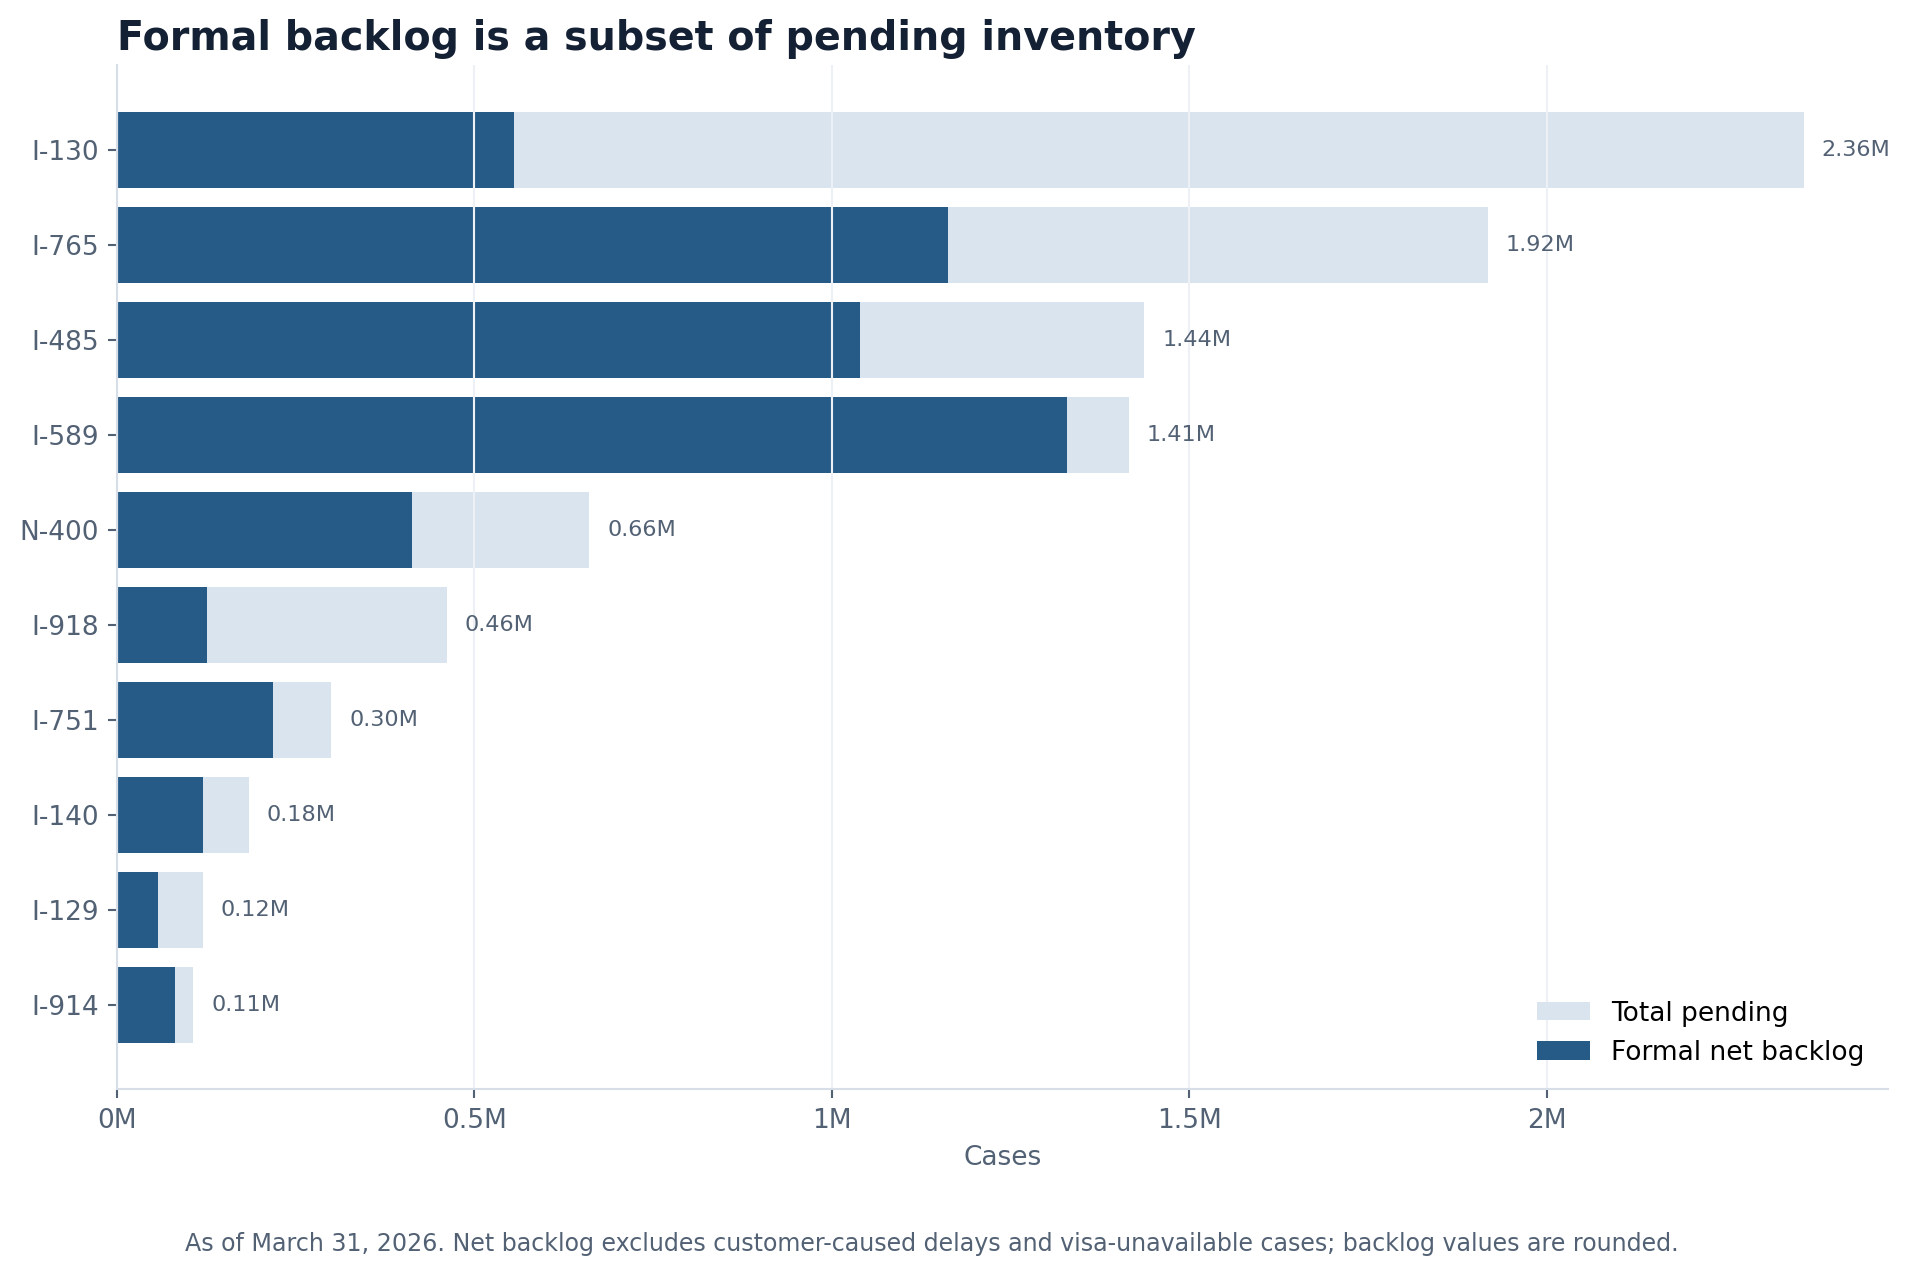
The pending count includes every case awaiting a final agency action. USCIS's backlog measure is narrower. It generally counts work that has remained pending beyond the agency's acceptable cycle time, then removes cases delayed by circumstances outside the agency's control, such as an unavailable visa number or a customer's response. Calling all 12.13 million cases "the backlog" collapses a 5.1 million-case difference.
The distinction does not make the operating pressure disappear. During the first half of fiscal 2026, USCIS received 4.27 million cases and completed 3.34 million. Inflow exceeded completions by about 929,000. Covered federal employment, meanwhile, was 20,241 in June, down 2,551 employees, or 11.2%, from its January 2025 peak in Office of Personnel Management data.
Those facts make staffing a plausible part of the story, but not the whole explanation. USCIS handles citizenship, green cards, family and employment petitions, work permits, asylum applications and other benefits with different legal rules and workloads. Some pending cases cannot move until a visa is available. Some wait on applicants. Screening and policy requirements change. Fee revenue may support positions without instantly producing trained officers in the directorate where work is accumulating.
The better way to understand the system is to follow four separate measures: what came in, what USCIS completed, what remained pending and what portion met the agency's definition of backlog.
Twelve million pending, seven million in formal backlog
USCIS's latest All Forms report covers the quarter ending March 31. It reports 12,129,908 cases pending in the fiscal-year-to-date total. The agency's separate Net Backlog and Frontlog workbook places the formal net backlog at 7,028,000 and the frontlog at 38,500, with those two measures rounded to the nearest hundred.
Frontlog is work still within the agency's target processing window. Net backlog starts with cases beyond that window and excludes categories USCIS treats as outside its control. The much larger total-pending measure contains all of them.
The relationship varies sharply by form.
| Form | Broad purpose | Total pending | Formal net backlog | Backlog share of pending |
|---|---|---|---|---|
| I-130 | Petition for alien relative | 2,359,470 | 555,100 | 23.5% |
| I-765 | Employment authorization | 1,917,467 | 1,162,500 | 60.6% |
| I-485 | Adjustment to permanent residence | 1,437,210 | 1,040,000 | 72.4% |
| I-589 | Asylum and withholding | 1,414,955 | 1,328,400 | 93.9% |
| N-400 | Naturalization | 660,692 | 413,300 | 62.6% |
| I-918 | U nonimmigrant status | 461,200 | 126,200 | 27.4% |
The I-130 line shows why the distinction matters. Only about one-quarter of its pending inventory appeared in formal net backlog. Family petitions can remain pending while a visa number is unavailable, among other reasons. By contrast, nearly 94% of pending I-589 asylum applications met the formal backlog definition.
Neither measure is a count of people. One person can have more than one application or petition, and a filing can involve derivative family members. The figures also do not show how difficult each case is. A form that requires an interview, security checks or extensive evidence is not equivalent to a simpler request merely because both count as one completion.
The formal backlog is still formidable. It represents roughly 58% of all pending work. But the proper conclusion is that USCIS had 12.13 million cases waiting and 7.03 million classified as net backlog, not that the two figures are interchangeable.
Receipts outran completions again
The long-run All Forms series shows how the agency arrived here. At the end of fiscal 2015, USCIS reported 3.28 million cases pending. That rose to 6.12 million in 2020, 9.03 million in 2023 and 11.65 million in 2025. The March 2026 endpoint was about 3.7 times the fiscal 2015 total.
The annual flow was not uniformly weak. USCIS completed 10.24 million cases in fiscal 2023 and 12.55 million in fiscal 2024, both far above the 7.01 million completed in 2021. Yet receipts also accelerated. They reached 12.94 million in 2024 and 12.98 million in 2025.
| Period | Receipts | Completions | Pending at period end |
|---|---|---|---|
| FY2015 | 7,650,475 | 7,851,938 | 3,276,182 |
| FY2020 | 7,469,320 | 7,214,772 | 6,115,551 |
| FY2021 | 8,839,722 | 7,010,652 | 8,037,262 |
| FY2023 | 10,455,676 | 10,237,739 | 9,027,348 |
| FY2024 | 12,938,465 | 12,554,248 | 9,474,182 |
| FY2025 | 12,981,570 | 11,037,994 | 11,651,012 |
| FY2026 through March 31 | 4,265,636 | 3,336,927 | 12,129,908 |
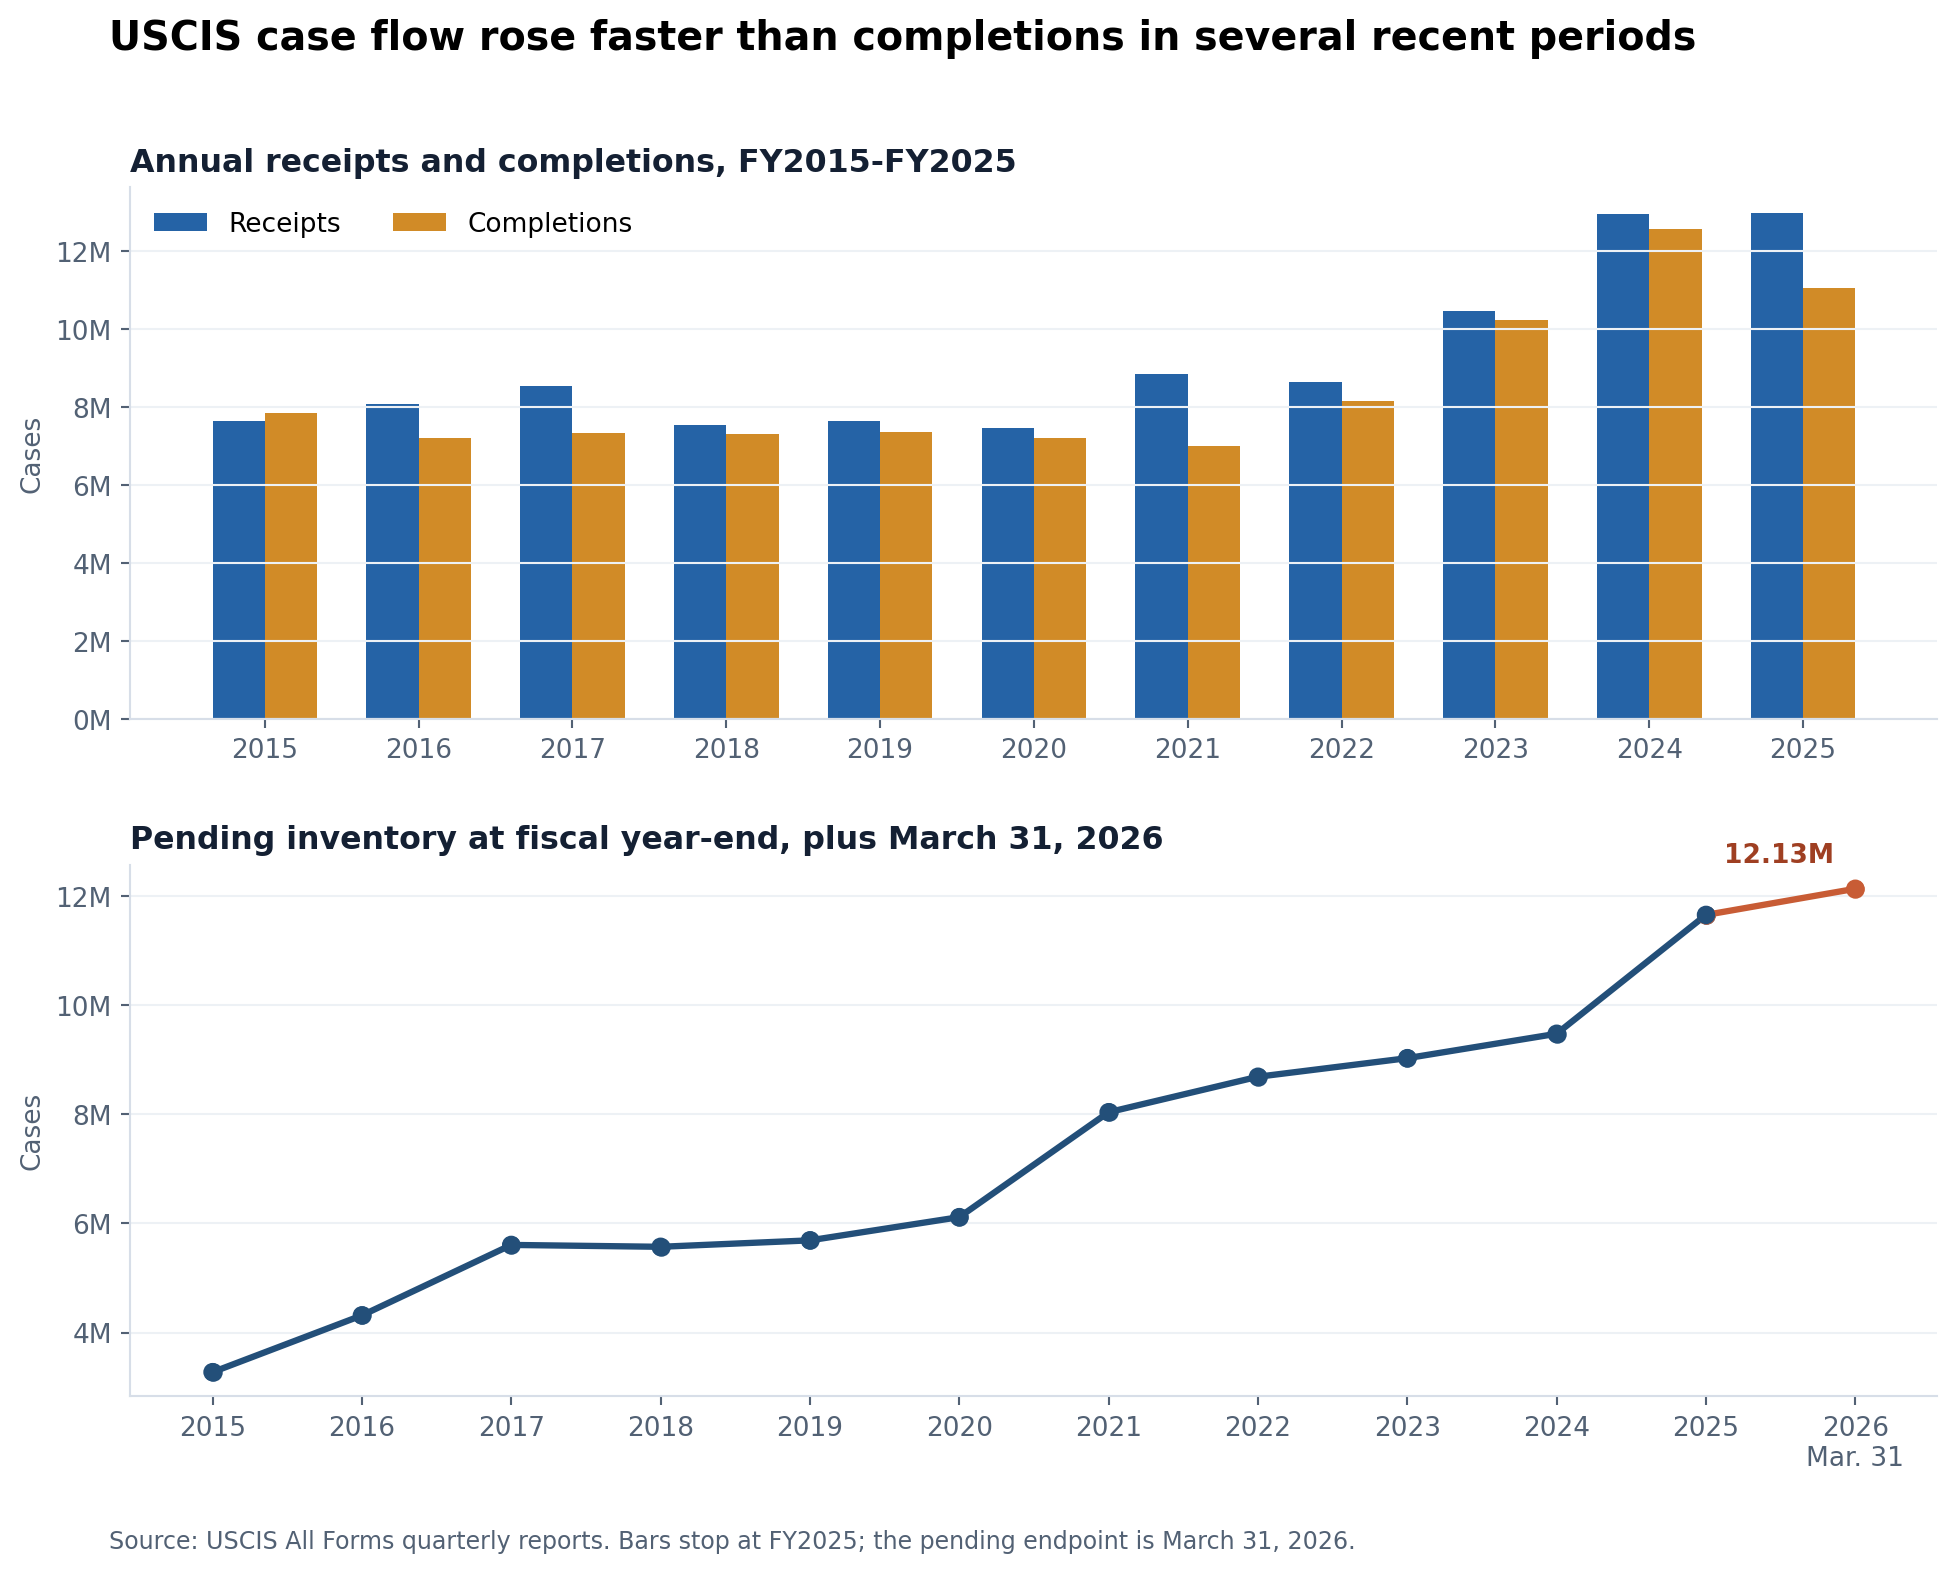
The most recent quarters widened the gap. USCIS received 2.12 million cases and completed 1.83 million in fiscal 2026's first quarter. In the second, receipts were nearly unchanged at 2.14 million, while completions fell to 1.51 million. Second-quarter completions were 17.4% below the first quarter, and receipts exceeded completions by 624,551.
That arithmetic explains inventory growth. It does not, by itself, explain why completions declined. The data do not identify a single bottleneck, and USCIS's workload is not fixed from one quarter to the next. Form mix, evidentiary requirements, interviews, fraud screening, applicant responses, visa availability and staffing allocation can all affect the amount of work behind a completion.
This multi-factor problem is not new. In GAO-21-529, the Government Accountability Office found that USCIS's pending caseload rose an estimated 85% from fiscal 2015 through 2020. USCIS officials cited policy changes, longer forms, expanded interview requirements, insufficient staffing and the suspension of in-person services during the pandemic. GAO also found that the agency relied on short-term staffing models but lacked a long-term workforce plan.
Several of GAO's recommendations were later implemented, including improvements to staffing models and timeliness measures. One remains open. As of January 2026, GAO said USCIS still did not agree that it needed the recommended long-term plan for acquiring, developing and retaining staff.
Processing time did not move in one direction
The inventory totals are stocks. Processing times are a different measure: how long completed cases spent between receipt and completion.
USCIS's historical processing-time table reports national medians for selected forms. The fiscal 2026 column currently covers completed cases from October 1, 2025 through May 31, 2026. It is not a full fiscal year, and it is not the same as the 80th-percentile method used on the current case-processing page.
Selected categories moved in both directions.
| Form and category | FY2025 median | FY2026 through May 31 | Change |
|---|---|---|---|
| I-130, immediate relative | 14.4 months | 12.9 months | -1.5 months |
| I-485, family-based adjustment | 7.4 | 5.8 | -1.6 |
| I-485, employment-based adjustment | 7.2 | 5.7 | -1.5 |
| I-485, asylee adjustment | 10.3 | 17.2 | +6.9 |
| I-765, pending-I-485 work permit | 2.2 | 4.6 | +2.4 |
| I-765, parole-based work permit | 0.9 | 5.9 | +5.0 |
| N-400, nonmilitary naturalization | 5.6 | 6.9 | +1.3 |
| I-914, T nonimmigrant status | 20.8 | 28.4 | +7.6 |
| I-918, U nonimmigrant status | 26.3 | 18.2 | -8.1 |
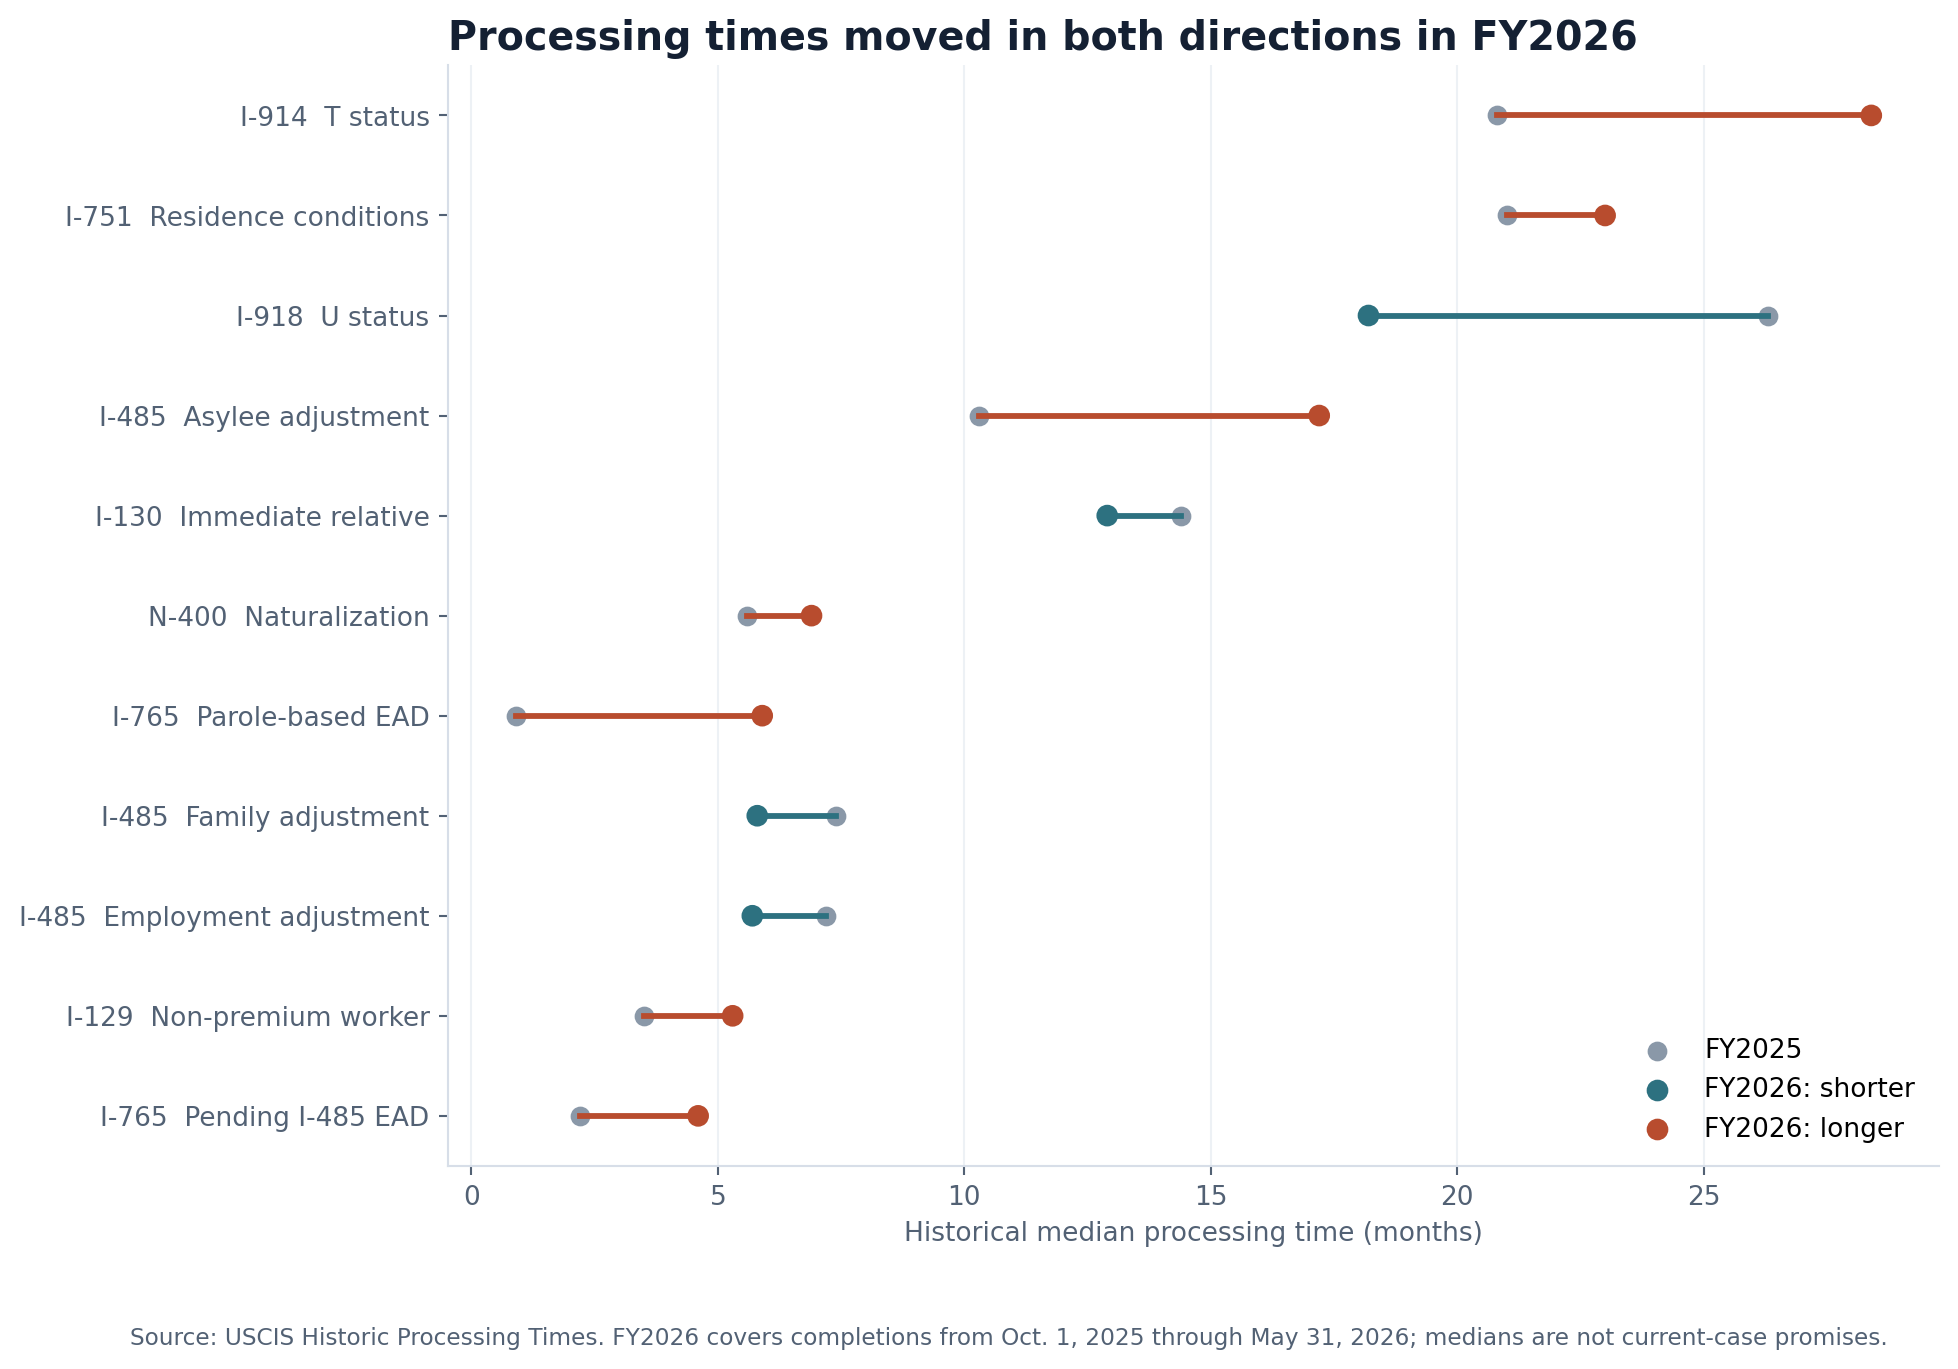
The data support a narrower statement than a universal slowdown. Asylee adjustment, several work-permit categories, T status and naturalization took longer in the selected comparisons. Immediate-relative petitions, family and employment adjustments, and U status improved.
These medians look backward at cases USCIS finished. They do not tell an applicant how long a currently pending case will take. USCIS also warns that historical figures can be revised as systems and post-adjudicative outcomes change. A single national median can conceal wide differences among field offices, service centers and case circumstances.
The workforce expanded for two decades, then contracted
USCIS did not enter this period with its 2004 staffing level. Covered federal employment more than doubled over two decades, according to FederalHiringData's analysis of OPM's legacy FedScope and monthly Federal Workforce Data.
September snapshots rose from 8,801 employees in 2004 to 13,246 in 2014, 19,208 in 2019 and 22,004 in 2024. The monthly series reached 22,792 in January 2025. By June 2026, it stood at 20,241.
Federal Hiring Data Weekly
Get the biggest federal workforce changes in your inbox.
Subscribe to Federal Hiring Data Weekly for federal hiring trends, salary data, agency movements, and original investigations, with email confirmation before delivery.
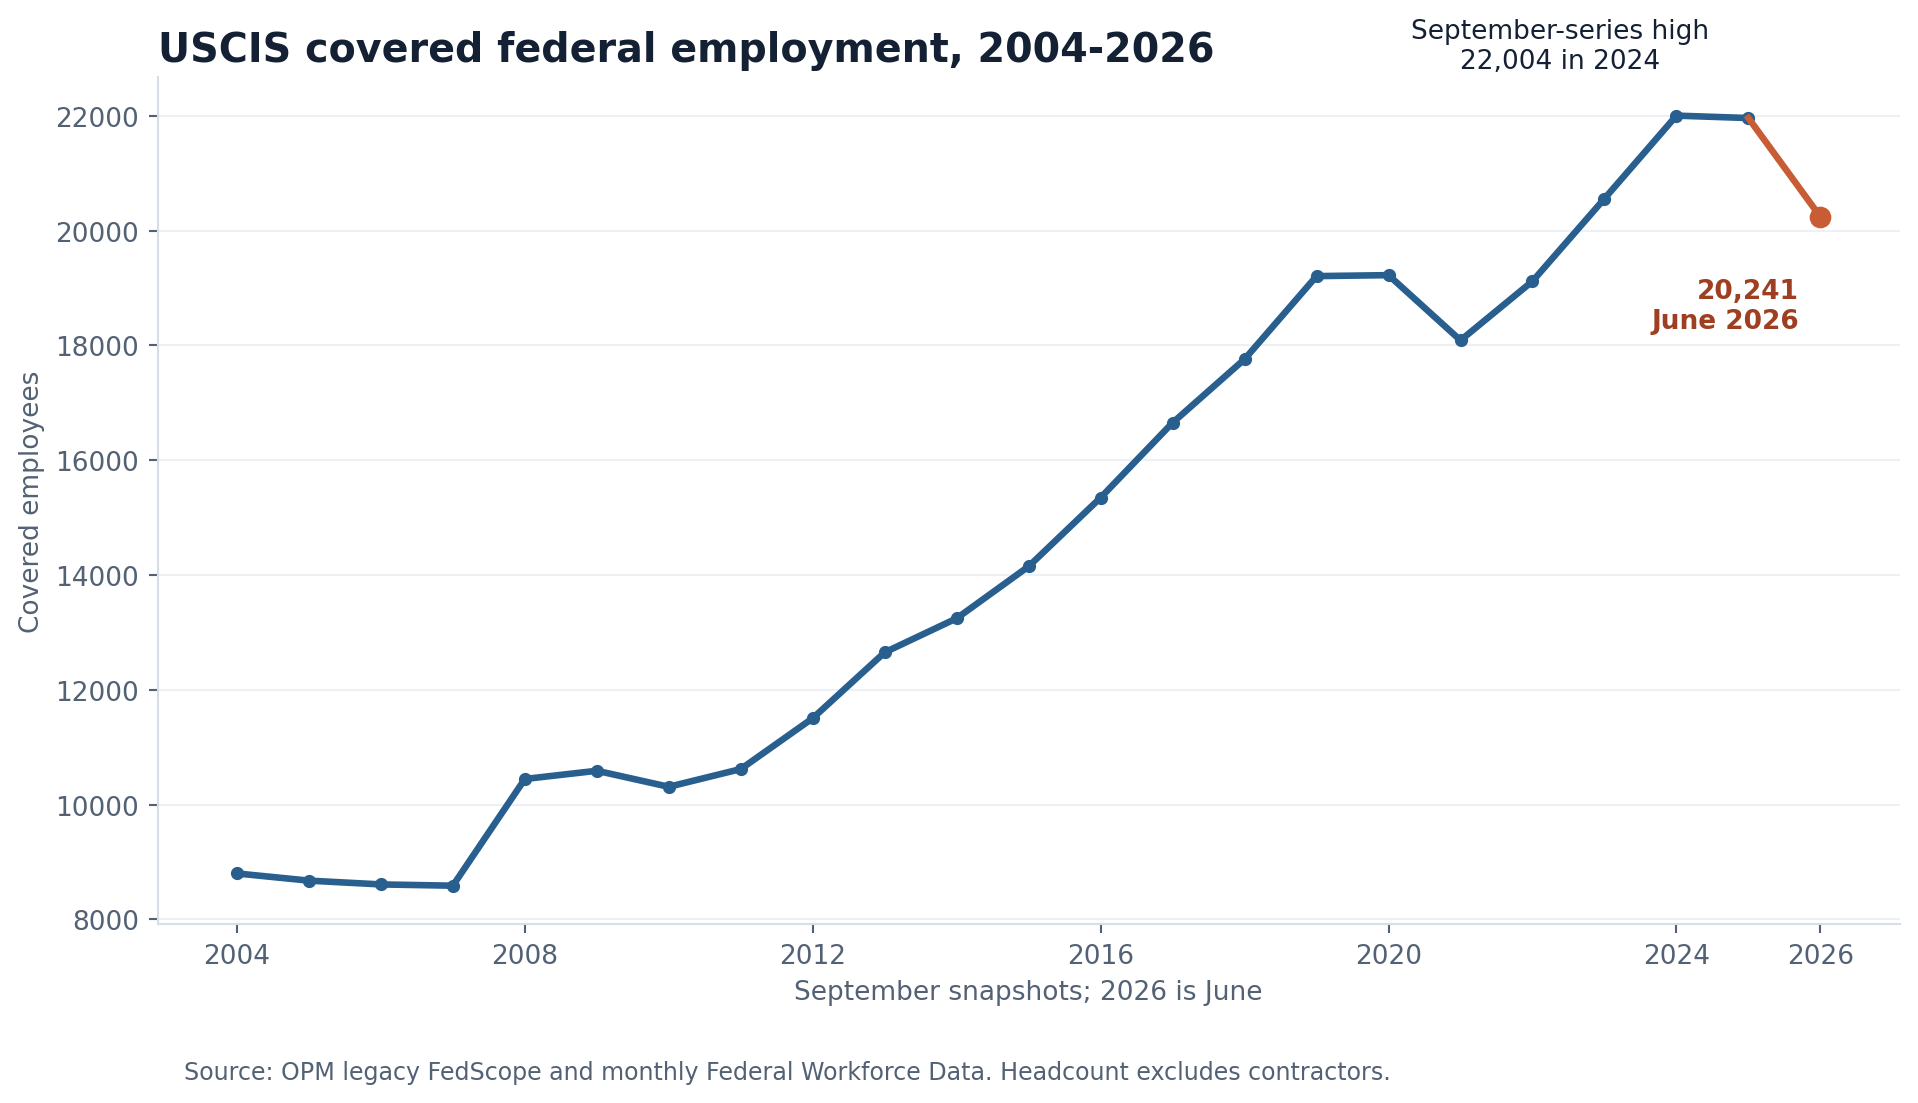
June remained 11,440 employees above September 2004, a 130% increase. It was also 2,551 below January 2025, an 11.2% decline in 17 months. Both statements are necessary. USCIS is much larger than it was at creation, and its recent covered workforce is materially smaller than its early-2025 peak.
Personnel-action files support the recent direction. OPM records 42 USCIS accessions and 1,232 separations in September 2025, followed by 38 accessions and 810 separations in October. The combined net was negative 1,962. OPM's revision files do not show a data correction large enough to explain that fall.
Personnel actions still require care. They do not reconcile exactly to monthly headcount because transfers, effective dates, data coverage and corrections differ. The files also do not say why an employee separated. The evidence establishes a large net outflow, not whether each departure reflected retirement, resignation, transfer, termination or another category without a separate analysis.
The occupational mix shows why total headcount cannot be translated directly into adjudication capacity. In June 2026, the largest OPM series within USCIS was 1801, General Inspection, Investigation, Enforcement and Compliance, with 10,538 employees. Administration and program work had 2,460; compliance support 1,690; management and program analysis 1,434; and hearings and appeals 1,211.
Those are broad federal occupation series, not a clean list of job titles. An 1801 employee may perform different work from another employee in the same series. OPM does not reveal training stage, case assignment, overtime, contractor support or the time required by the forms on an officer's desk.
Dividing completions by covered employees would therefore produce a ratio, not a productivity measure. It would treat unlike cases as equal units, ignore contractors and automation, and assume the year-end workforce performed all work completed during the year. The public data do not support that claim.
A fee-funded agency still has capacity constraints
USCIS is unusual among large federal operating agencies because fees, rather than annual appropriations, finance most of its work. The agency's FY2024 Immigration Examinations Fee Account statement reported $6.22 billion in revenue: $4.96 billion from nonpremium fees and $1.26 billion from premium processing. Direct obligations were $5.69 billion, and adjusted ending carryover was $2.93 billion.
USCIS said the fee account represented about 93% of its direct budget authority that year. Its 2024 fee rule forecast about $1.14 billion in additional annual revenue to support workload.
The DHS fiscal 2026 Budget in Brief presents another view, using full-time equivalents rather than employee headcount. It reports 22,270 USCIS FTE in fiscal 2024, an estimated 23,599 in 2025 and 22,711 in the 2026 request. Of the 2026 request, 22,424 FTE and $6.82 billion were under mandatory and fee funding; 22,104 FTE and $6.74 billion were specifically tied to the examinations fee account.
| FY2024 IEFA measure | Amount |
|---|---|
| Nonpremium revenue | $4.96 billion |
| Premium-processing revenue | $1.26 billion |
| Total revenue | $6.22 billion |
| Direct obligations | $5.69 billion |
| Adjusted ending carryover | $2.93 billion |
Revenue is not the same as immediately deployable capacity. Hiring takes time. New officers need background checks, onboarding and training. Workload can rise in one program while revenue comes from another. A carryover balance can include resources reserved for future obligations or volatility rather than idle money available for any purpose.
The fee model also makes demand part of the budget mechanism. More filings can generate more revenue, but they simultaneously create more cases to process. If receipts arrive faster than USCIS can recruit, train and assign staff, a higher fee balance does not prevent pending inventory from growing in the near term.
Policy changes can alter the work inside each filing as well. An August 2025 USCIS policy update clarified discretionary factors for certain benefit requests, including national-interest waivers and investor cases, and applied the guidance to pending and future requests. USCIS's broader process already included identity, fraud, public-safety and national-security screening.
The public record does not quantify how many additional officer hours that update required. It would be unsupported to attribute the fiscal 2026 completion decline to that memo. The defensible point is that the unit of work is not fixed: statutes, court orders, policy, evidentiary standards and screening practices can change what an adjudicator must do even when the form number stays the same.
Recruiting remained substantial, but announcements are not hires
FederalHiringData's historical USAJOBS archive contains 17,350 distinct USCIS announcements opened from March 1, 2017 through April 9, 2026. Inspection and compliance series accounted for 6,364. Administration and program work accounted for 3,274, followed by management analysis at 1,867 and compliance support at 1,748.
Related research
Put this finding in context

Data investigationsAugust 18, 2026
Federal FOIA Backlog Hit 339,671 as DHS Carried Nearly Half
The federal FOIA backlog rose 27% in fiscal 2025. DHS held 168,505 pending requests while request volume grew and two different public staffing measures moved downward.
Data investigationsAugust 23, 2026
ICE Got 150,000 Applications. Its Workforce Grew by About 9,600 at the Peak.
OPM recorded 10,030 new-hire actions during ICE's surge, but tentative offers were not final hires and covered employment had receded by June.
The most common advertised starting grades were GS-13, GS-14, GS-9, GS-5 and GS-12. Almost the entire archive used the General Schedule: 17,258 announcements, with a median advertised annual range of about $79,239 to $115,511 among records with usable annual salary fields.
Washington, D.C., and Camp Springs, Maryland, were the two most frequent stored location mentions, each appearing in roughly 1,700 announcements. Lee's Summit, Missouri; Chicago; Arlington, Virginia; Houston; Los Angeles; Dallas; and San Francisco also appeared frequently. A posting can contain multiple locations, so location mentions cannot be added into a workforce total.
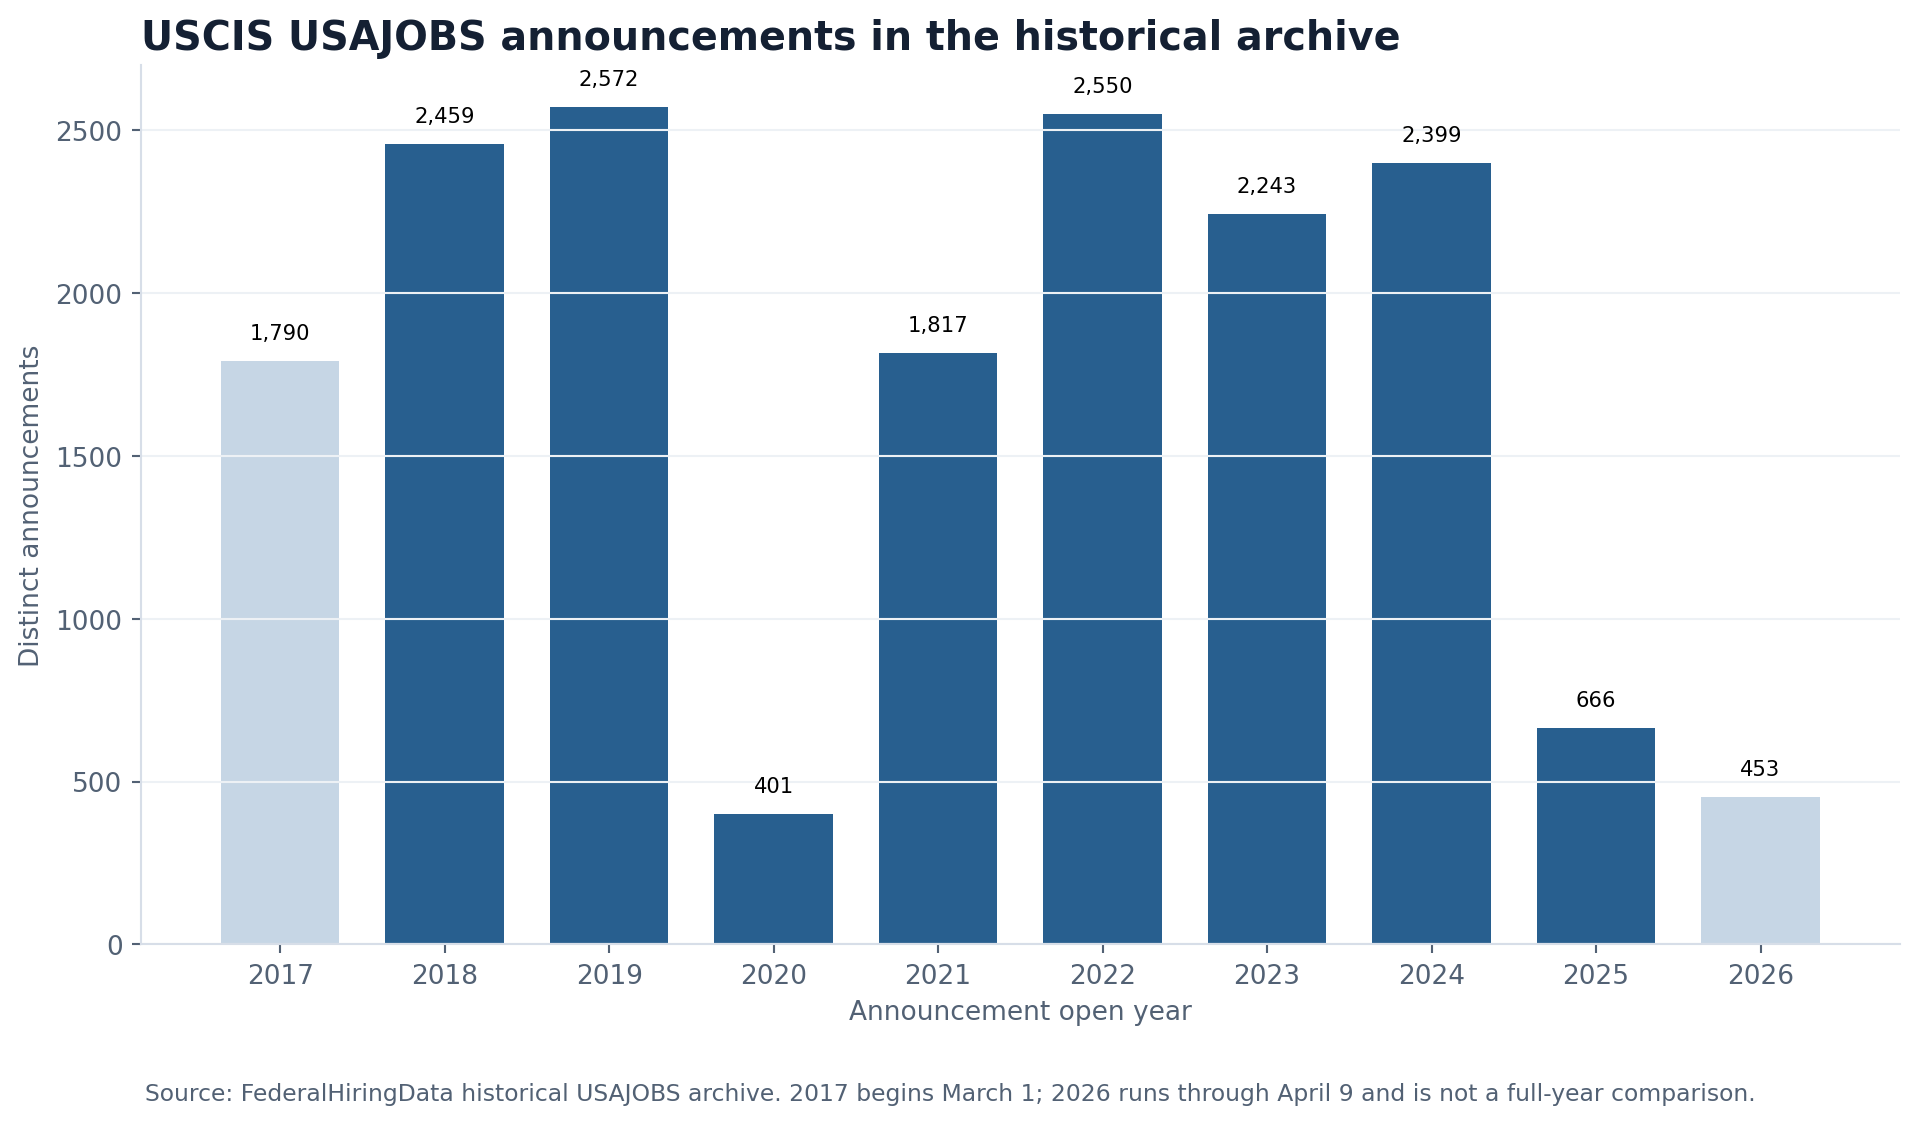
The archive records 2,459 announcements opened in 2018, 2,572 in 2019, 2,550 in 2022 and 2,399 in 2024. It records 666 in 2025. The series shows a hiring channel that was active but uneven; it does not explain why the annual count changed.
The first and last years are incomplete. Coverage starts in March 2017, and the 2026 observation ends April 9. Historical remote and telework fields are not consistent enough across these records to publish a reliable USCIS remote-work share, so one is not presented here.
Most importantly, an announcement is not a hire. One notice can cover several vacancies or locations, establish a register, close without a selection or be canceled. USAJOBS does not reveal every applicant, offer, entry-on-duty date or employee who remained. The archive shows recruiting activity, while OPM shows covered employees onboard.
Readers can search current federal jobs, compare agency hiring records, explore broader federal workforce statistics and read more FederalHiringData investigations.
The limiting factor is a combination, not one number
USCIS can control some parts of this system more directly than others. It can allocate staff, improve technology, redesign processes, set internal cycle-time goals and request or use resources under governing law. It cannot make a visa number available before the statutory allocation permits one, answer an applicant's request for evidence, or erase the different legal requirements attached to hundreds of form categories.
That is why the formal backlog subtracts some pending cases. It is also why the 7.03 million figure is the better measure of overdue work under USCIS's own framework, while the 12.13 million total is the better measure of everyone and everything still awaiting final action.
The first half of fiscal 2026 brought a clear warning. Receipts exceeded completions by 929,000. The second-quarter completion pace fell. Several important processing-time medians worsened. Covered employment remained 11% below its January 2025 peak.
There is meaningful counterevidence. Some processing times improved. USCIS's workforce remained more than twice its 2004 size. The agency had recently demonstrated the ability to complete more than 12 million cases in a year. Fee revenue and carryover were substantial.
Together, those facts point away from a single-cause explanation. Application volume, form mix, workforce capacity, training, policy requirements, fee timing and external delays all shape the queue. Staffing changed enough to plausibly matter. The public data do not establish how much of the latest slowdown it caused.
The strongest future test will be whether completions again catch receipts while the formal backlog share falls, not simply whether total pending moves in one quarter. That requires USCIS to keep publishing both measures with consistent definitions. Without them, a large number can describe a real problem and still describe the wrong one.
Methodology and limitations
Caseload and backlog: FederalHiringData reconstructed annual receipts, completions and pending inventory from official USCIS All Forms reports for fiscal 2015 through fiscal 2025 and the fiscal 2026 Q2 workbook. FY2026 values are partial through March 31. The Q2 workbook's quarter-total pending cell differs from its fiscal-year-to-date total by three cases; this article uses the fiscal-year-to-date value of 12,129,908. Formal backlog and frontlog come from USCIS's Q2 workbook and are rounded by the agency. USCIS's data library was rechecked on August 23, 2026; Q2 remained the newest All Forms release.
Processing times: Selected values come from USCIS's Historic Processing Times page. FY2026 covers October 1, 2025 through May 31, 2026. These are medians for completed cases, not current-case estimates. USCIS warns that historical and current processing pages can use different methods and that past values may be revised.
Workforce: FederalHiringData queried OPM legacy FedScope and monthly Federal Workforce Data for USCIS subelement HSAB. The long series uses September snapshots from 2004 through 2025 and June 2026 as the latest endpoint. The recent peak uses monthly data. Covered employment excludes contractors and does not equal budget FTE. Occupation series are broad classifications, not job titles or a count of adjudicators.
Recruiting: The FederalHiringData historical USAJOBS archive was filtered to exact agency code HSAB. It contains distinct announcements opened from March 1, 2017 through April 9, 2026. Announcements are not hires or vacancies filled. One announcement may include several vacancies and locations. Salary figures are medians of stored annual announcement ranges where usable and are not offers or guaranteed pay. Historical remote and telework fields were not reliable enough for a published share.
Funding and policy: Revenue and obligations come from USCIS's FY2024 IEFA financial statement. Budget FTE and funding come from DHS's FY2026 Budget in Brief. Policy context is limited to official USCIS material. No causal effect is assigned to a policy change because the public sources do not quantify one.
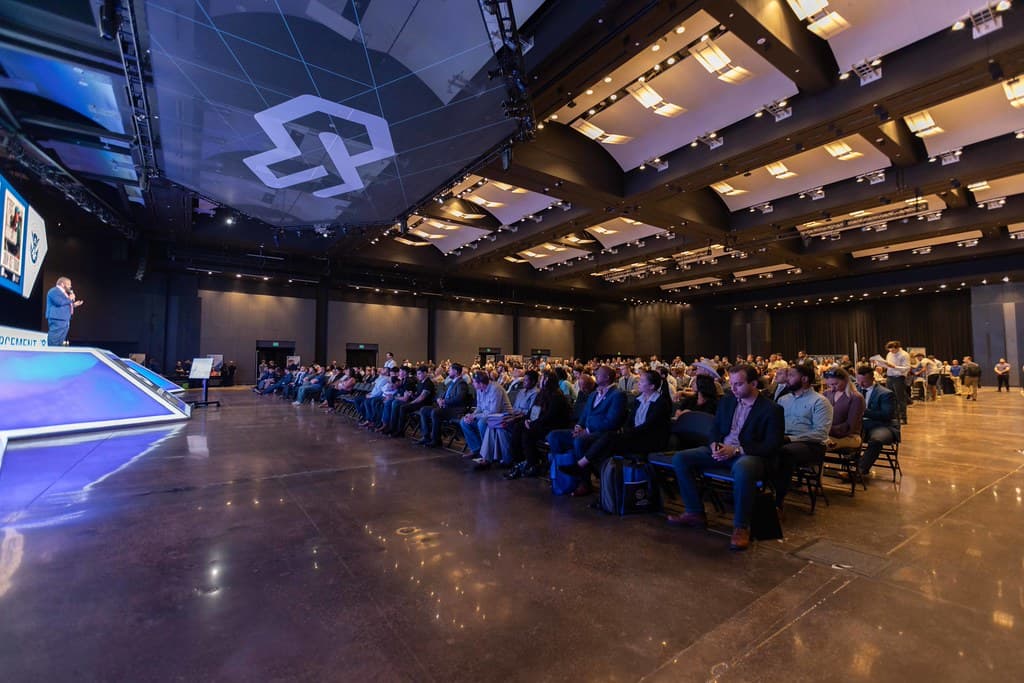
The hero photograph shows a USCIS employee town hall in Camp Springs, Maryland, on June 20, 2024. It was photographed by Mikaela McGee for the U.S. Department of Homeland Security and is an official U.S. government work.
Continue reading
More from FederalHiringData

Data investigationsAugust 22, 2026
IHS Launched Its Largest Hiring Push. Its Covered Workforce Fell 458 by June.
IHS launched against severe provider vacancies, but covered employment fell 458 from January through June and the campaign still lacks a public numeric target.
Data investigationsAugust 23, 2026
The 2030 Census Test Cut Its Hiring Goal 91%. Its Workforce Assessment Is Paused.
The first major 2030 field test shrank from six sites to two and from 1,247 planned workers to 112 while a bureau-wide skills assessment remained paused.
Data investigationsAugust 18, 2026
FEMA's Public Workforce Count Fell 22% as GAO Warned of Readiness Risks
FEMA had 5,793 fewer covered civilian employees in June 2026 than in January 2025. GAO says the agency cut staff without the workforce planning needed to assess mission capacity.
Federal Hiring Data Weekly
Get the biggest federal workforce changes in your inbox.
Subscribe to Federal Hiring Data Weekly for federal hiring trends, salary data, agency movements, and original investigations, with email confirmation before delivery.