August 21, 2026
Federal Prisons Lost 1,166 Officers. Overtime Became the Backstop.
BOP staffing has begun a small rebound, but the officer corps remains thinner and the last public operational measures show rising overtime and augmentation.
By Evan Mercer
Published August 21, 2026Last edited August 21, 2026
The federal prison system has started to add correctional officers again. It is doing so from the bottom of a long decline.
The Bureau of Prisons had 14,685 correctional officers in the Office of Personnel Management's covered-employment data in June 2026. That was 181 more than in April, when the count reached its lowest point in the modern monthly series. It was still 1,166 below January 2025.
That net loss does not prove that 1,166 individual officers quit, nor does it measure every position BOP says it needs. It shows that a recruiting campaign, new pay measures and a large funding package had not yet rebuilt the officer corps to where it stood 17 months earlier.
The operational record explains why headcount alone is not enough. The last national figures BOP reported to the Government Accountability Office showed overtime rising 43% from fiscal 2021 to almost 9 million hours in 2024. Hours spent on "augmentation," when teachers, nurses, maintenance workers and other employees are assigned to correctional posts, rose 15%. Recent federal inspections continued to find prisons using those measures to keep posts covered.
The most defensible conclusion as of August 2026 is therefore a guarded one: staffing has improved slightly since spring, but there is no public evidence that the shortage has ended. Overtime, augmentation and repeated recruiting have operated as a backstop. They have kept work moving without creating the same durable capacity as a fully staffed institution.
A dramatic shortage estimate with a dated clock
GAO's 2025 High-Risk report said BOP estimated a deficit of more than 9,500 correctional officers and about 3,000 medical professionals. Those figures are often repeated as if they were current vacancy counts. They are not.
The estimates came from BOP during GAO's late-2024 review cycle. GAO published them in February 2025 alongside a warning that BOP still needed to improve how it allocated staff. The public report does not provide the institution-level denominator, funding assumptions or occupational detail needed to reproduce the estimates from current data.
The distinction matters because three different numbers can all be called a staffing gap:
| Measure | What it answers | What it does not answer |
|---|---|---|
| Authorized or budgeted positions | How many positions were approved or funded | Whether that number covers every required post and shift |
| Filled positions | How many employees occupied those positions at a point in time | Whether leave, training, turnover and local workload left enough coverage |
| Staffing-needs estimate | How many positions a model says an institution needs | Whether every modeled position was funded or immediately fillable |
GAO had identified that ambiguity years earlier. Its 2021 staffing review found reliability problems in all three methods BOP was then using to calculate staffing levels. BOP later hired a contractor, developed a new automated staffing tool and rolled it out in October 2024. GAO closed its recommendation on the calculation method in 2025 after BOP reported that the tool was being updated quarterly.
That is progress. It also means the 9,500 and 3,000 figures came from a newer internal assessment that cannot be reconstructed from a simple subtraction of filled jobs from a published budget table. No public revision located for this analysis makes those figures current to August 2026. They are best understood as BOP's dated estimate of need, not a live vacancy counter.
The workforce fell again after a recruiting rebound
OPM's public records provide a narrower but consistent measure: employees on BOP's covered rolls.
BOP's total workforce rose during 2024. GAO described a net gain of about 900 employees, while BOP later reported nearly 4,000 hires and about 2,800 separations, a net gain of almost 1,200 under its internal count. The exact totals differ because the sources use different dates and employment universes.
The rebound did not hold. OPM data show total BOP employment declining from 36,058 in January 2025 to 33,786 in June 2026, a net reduction of 2,272, or 6.3%. Correctional officers fell from 15,851 to 14,685, a reduction of 1,166, or 7.4%.
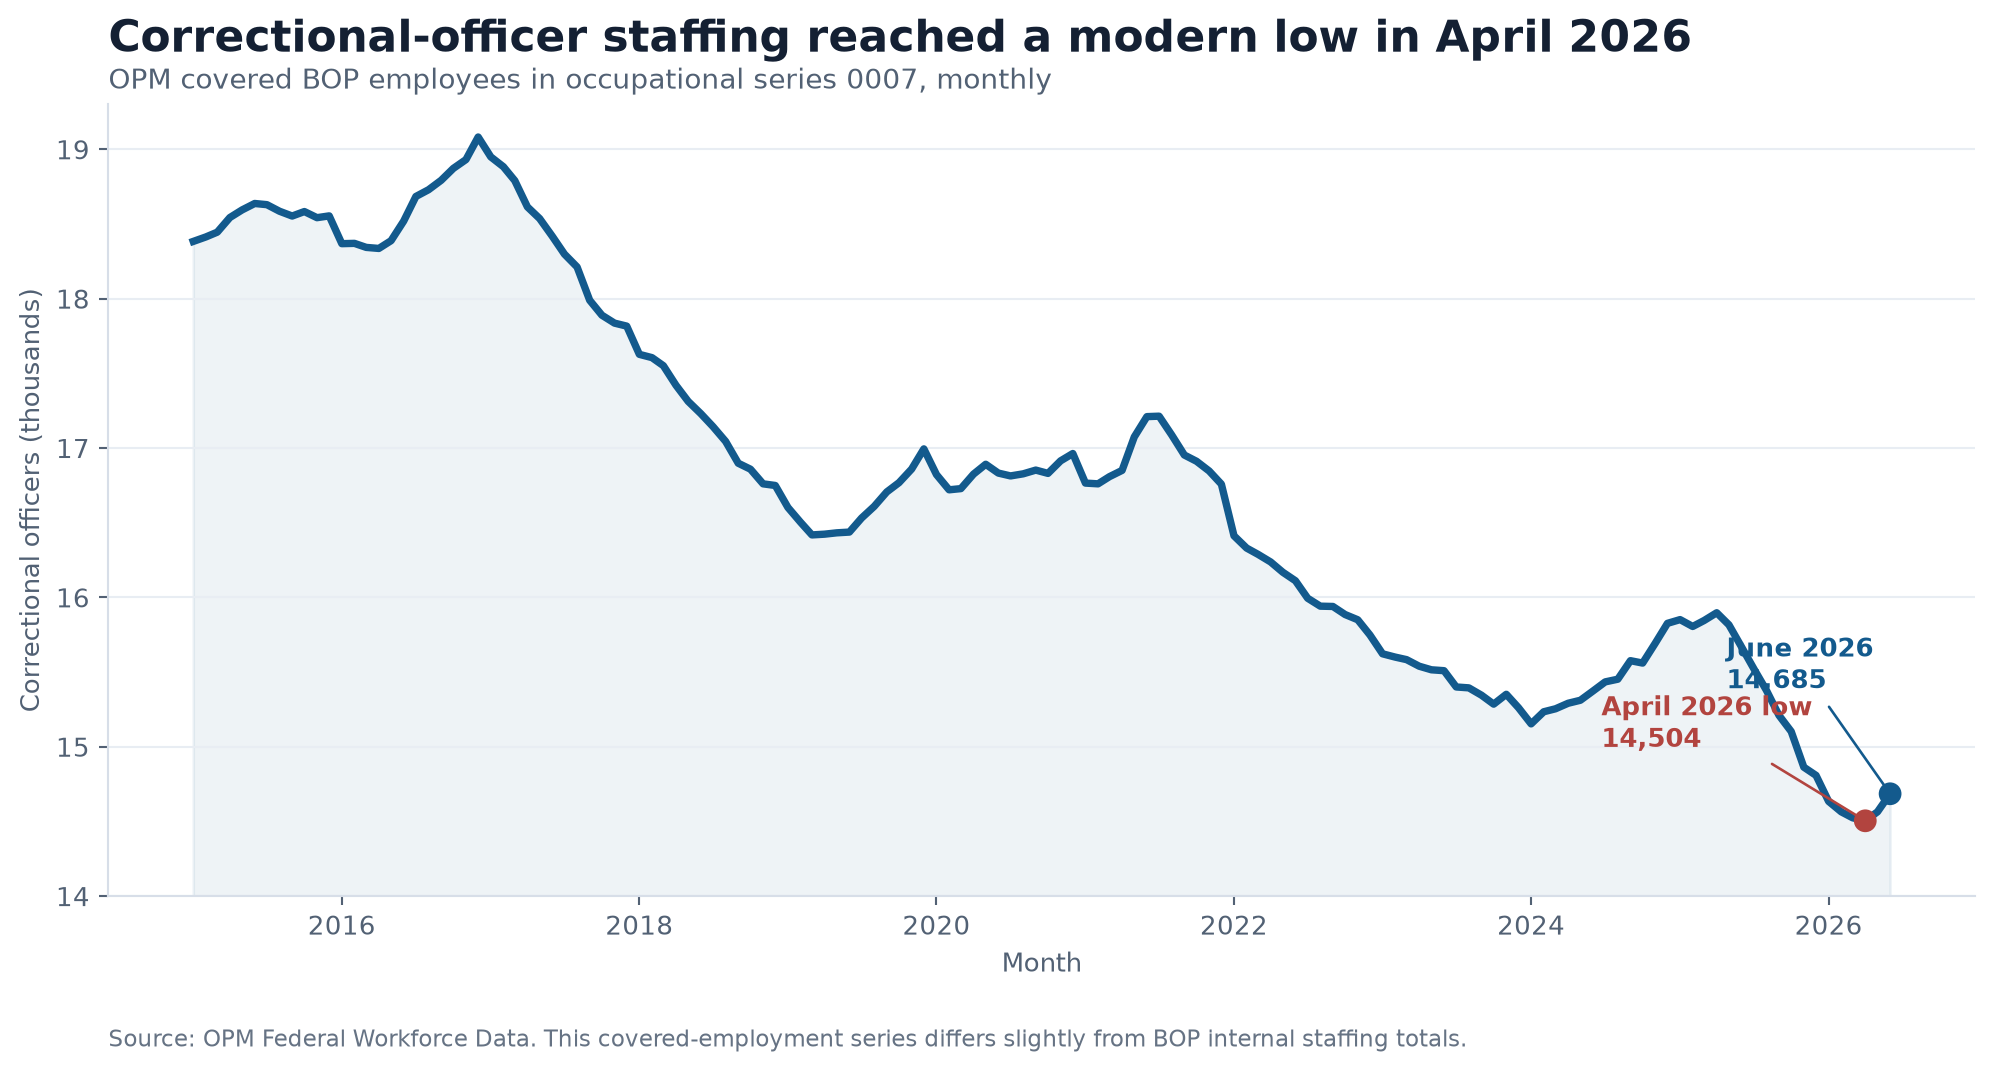
The decline is longer than one difficult year. BOP had 18,792 covered correctional officers in occupational series 0007 in September 2016. By June 2026 it had 4,107 fewer, a 21.9% reduction. Total BOP employment in June was near the agency's September 2001 level and below every September snapshot from 2002 through 2025.
Other occupations moved in the same direction after September 2024. Nurses fell by 89, physicians by 24 and psychologists by 60 through June 2026. A selected facilities and maintenance proxy fell by 65. Human Resources Management declined by 19.
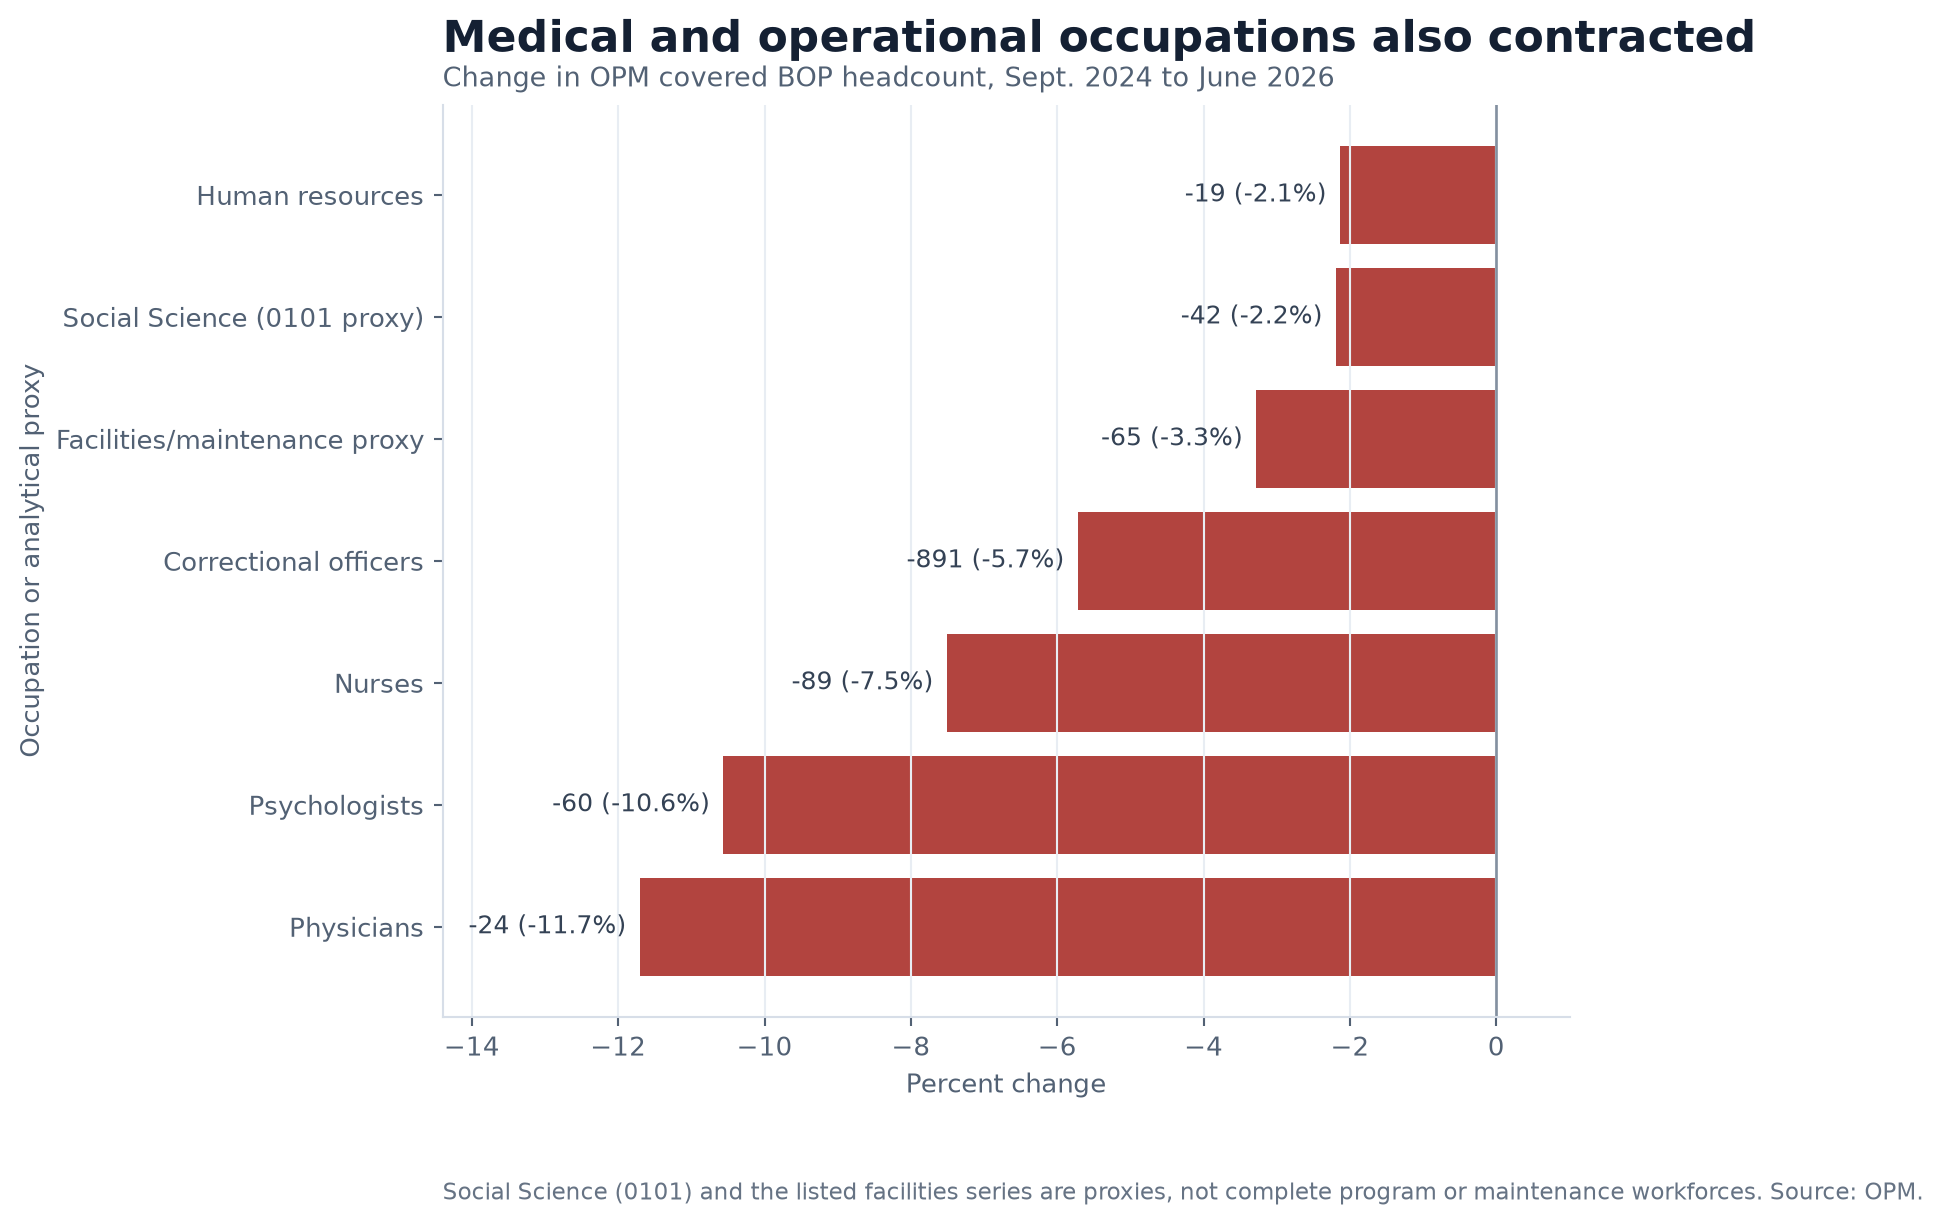
These are net headcount changes, not a roster of unmet positions. The Social Science series is only a proxy for some program and case-related work, and the facilities group contains selected trades and support series rather than every employee who maintains a prison. The common direction is still important: the latest decline did not stop at the correctional-services department.
There is one encouraging turn. Total employment rose by 215 from April through June 2026, and the correctional-officer count rose by 181. Two months do not establish a durable recovery, but they are evidence that the slide was not continuing uninterrupted at the most recent OPM observation.
The prison population is the strongest counterargument
A staffing account that ignores the inmate population would overstate the case.
BOP's official annual total reached 219,298 inmates in 2013, then fell to 155,270 in 2025. The agency's live total was 153,267 on Aug. 20, 2026. Its workload did not stay at the peak while staffing declined.
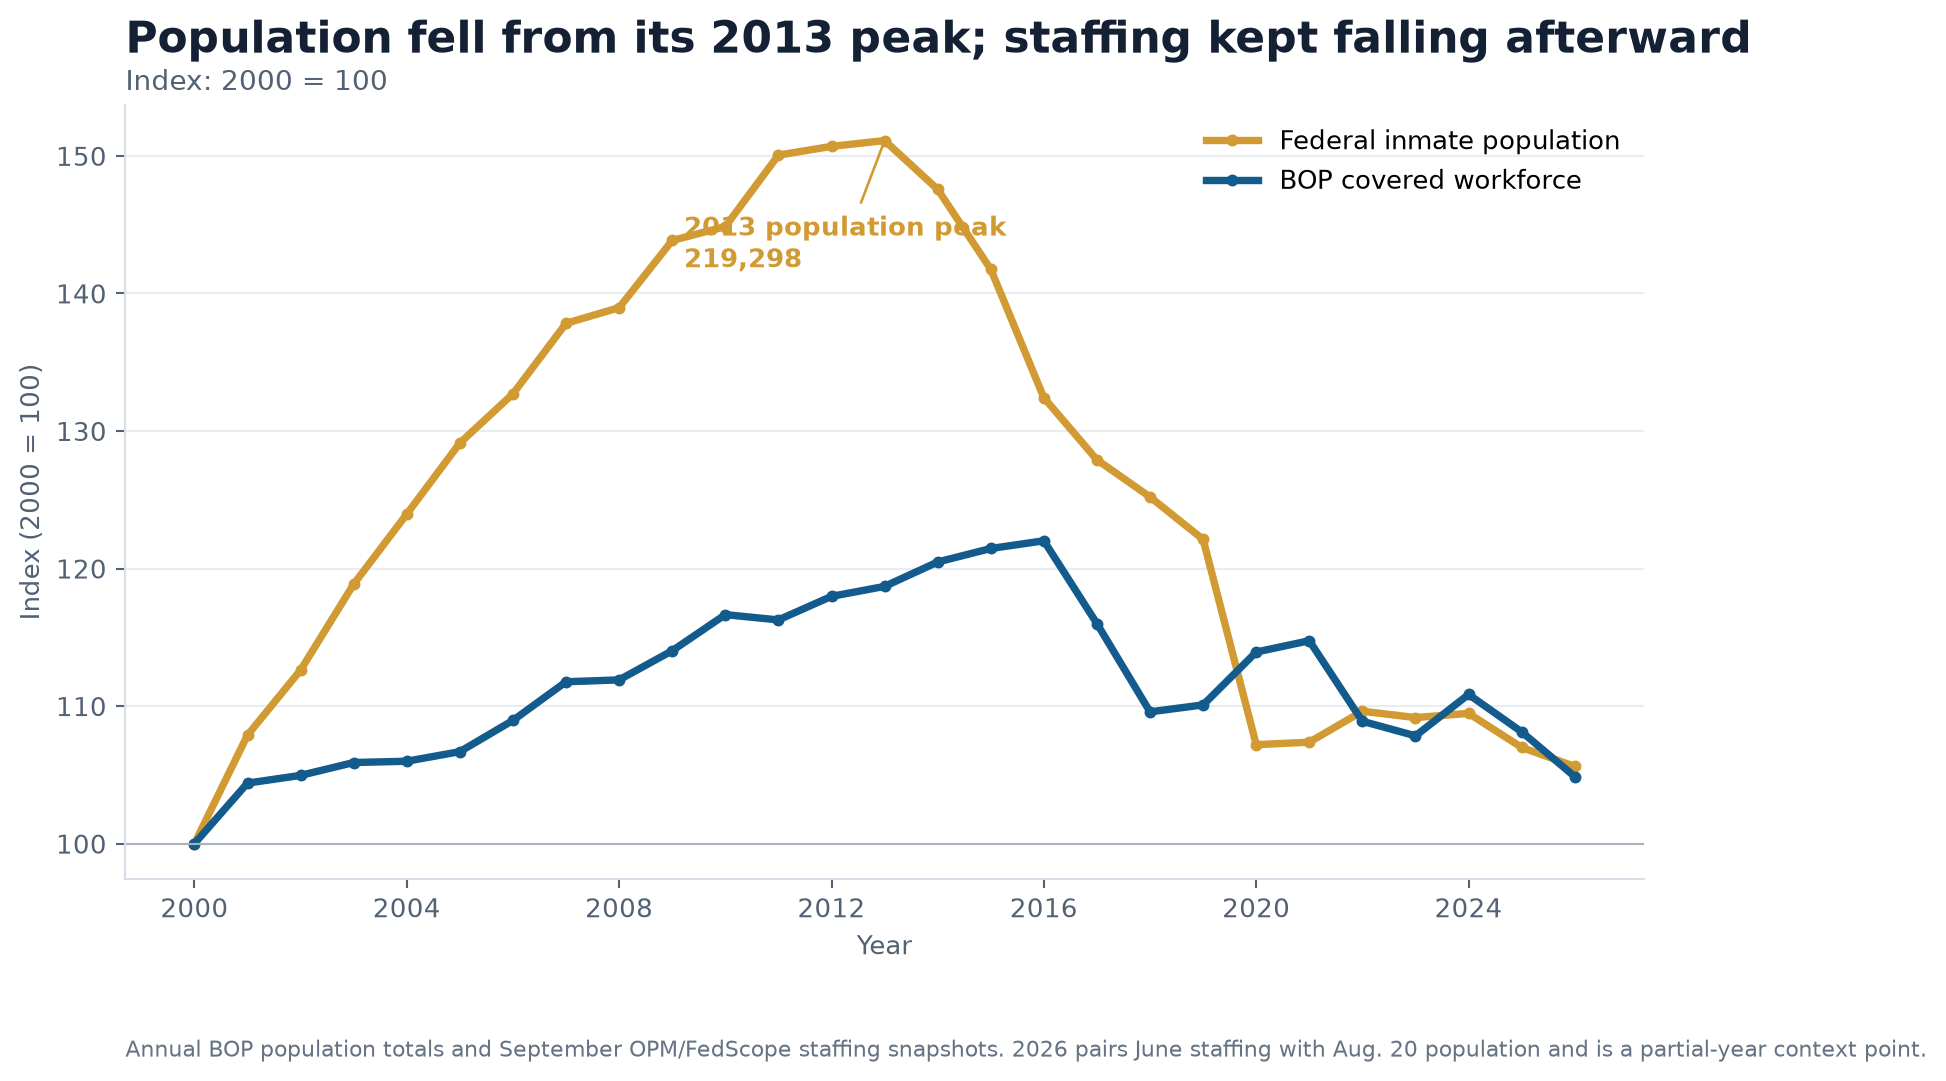
FederalHiringData calculation: Using September OPM staffing snapshots and BOP's annual population totals, there were about 4.50 inmates per covered employee in 2000, 5.73 at the 2013 population peak and 4.46 in 2025. Pairing June 2026 staffing with the Aug. 20 population produces a mixed-date context ratio of 4.54.
The aggregate ratio is therefore close to 2000 and far below 2013. That is meaningful counterevidence to a claim that BOP simply has more inmates for every worker than ever before.
It does not settle whether a prison is adequately staffed. A high-security complex, medical center and minimum-security camp do not have interchangeable post plans. A housing unit, perimeter post, control room or medical escort can require coverage regardless of whether a systemwide population falls by a few thousand. Leave, training and vacancies also determine who is available on a particular shift.
The national correctional-officer ratio illustrates the same tension. Inmates per covered correctional officer were about 10.23 in 2016, 10.20 in 2024 and 10.21 in 2025. The latest mixed-date comparison is about 10.44. Officer staffing broadly declined with the population until the recent dip became slightly steeper. Aggregate workload looks relatively stable; institution-level evidence does not.
Overtime and augmentation became operating capacity
The clearest national measure of the backstop comes from payroll.
A DOJ Inspector General analysis found that BOP employees worked 6,710,437 overtime hours in fiscal 2019. That was the equivalent of 3,107 full-time positions and cost $300.9 million. Correctional officers accounted for 71% of the hours and 69% of the cost.
The same audit supplies a useful denominator. BOP had budgeted for 38,557 positions but filled 35,790, leaving 2,767 positions unfilled. Within the correctional-officer series, 16,936 of 20,446 budgeted positions were filled, a gap of 3,510, or 17%. That budget gap is not the same thing as BOP's later staffing-needs estimate: a funded position can be filled while an institution still lacks enough people for every post, and a staffing model can call for positions that Congress has not funded.
The comparison nevertheless shows the scale of the operating response. The 3,107 full-time-equivalent overtime figure was larger than the total count of unfilled budgeted positions, though it was spread among employees, occupations and institutions and cannot be converted one-for-one into permanent jobs. Overtime covers a particular shift. It does not add a second person to the roster for the next shift, replace specialized clinical skills or create spare capacity for leave and training.
Federal Hiring Data Weekly
Get the biggest federal workforce changes in your inbox.
Subscribe to Federal Hiring Data Weekly for federal hiring trends, salary data, agency movements, and original investigations, with email confirmation before delivery.
The burden was concentrated. Fourteen percent of employees who worked overtime generated half of all overtime hours. Twenty-six employees recorded more than 2,160 overtime hours, more than a full-time work year on top of their regular schedules; 19 were correctional officers. Nineteen locations generated half of institution overtime while accounting for about 36% of BOP's workforce.
The public series is incomplete after 2019. GAO's recommendation tracker supplies the next firm national comparison: from fiscal 2021 through 2024, overtime hours rose 43%, reaching almost 9 million. Augmentation hours rose 15%.
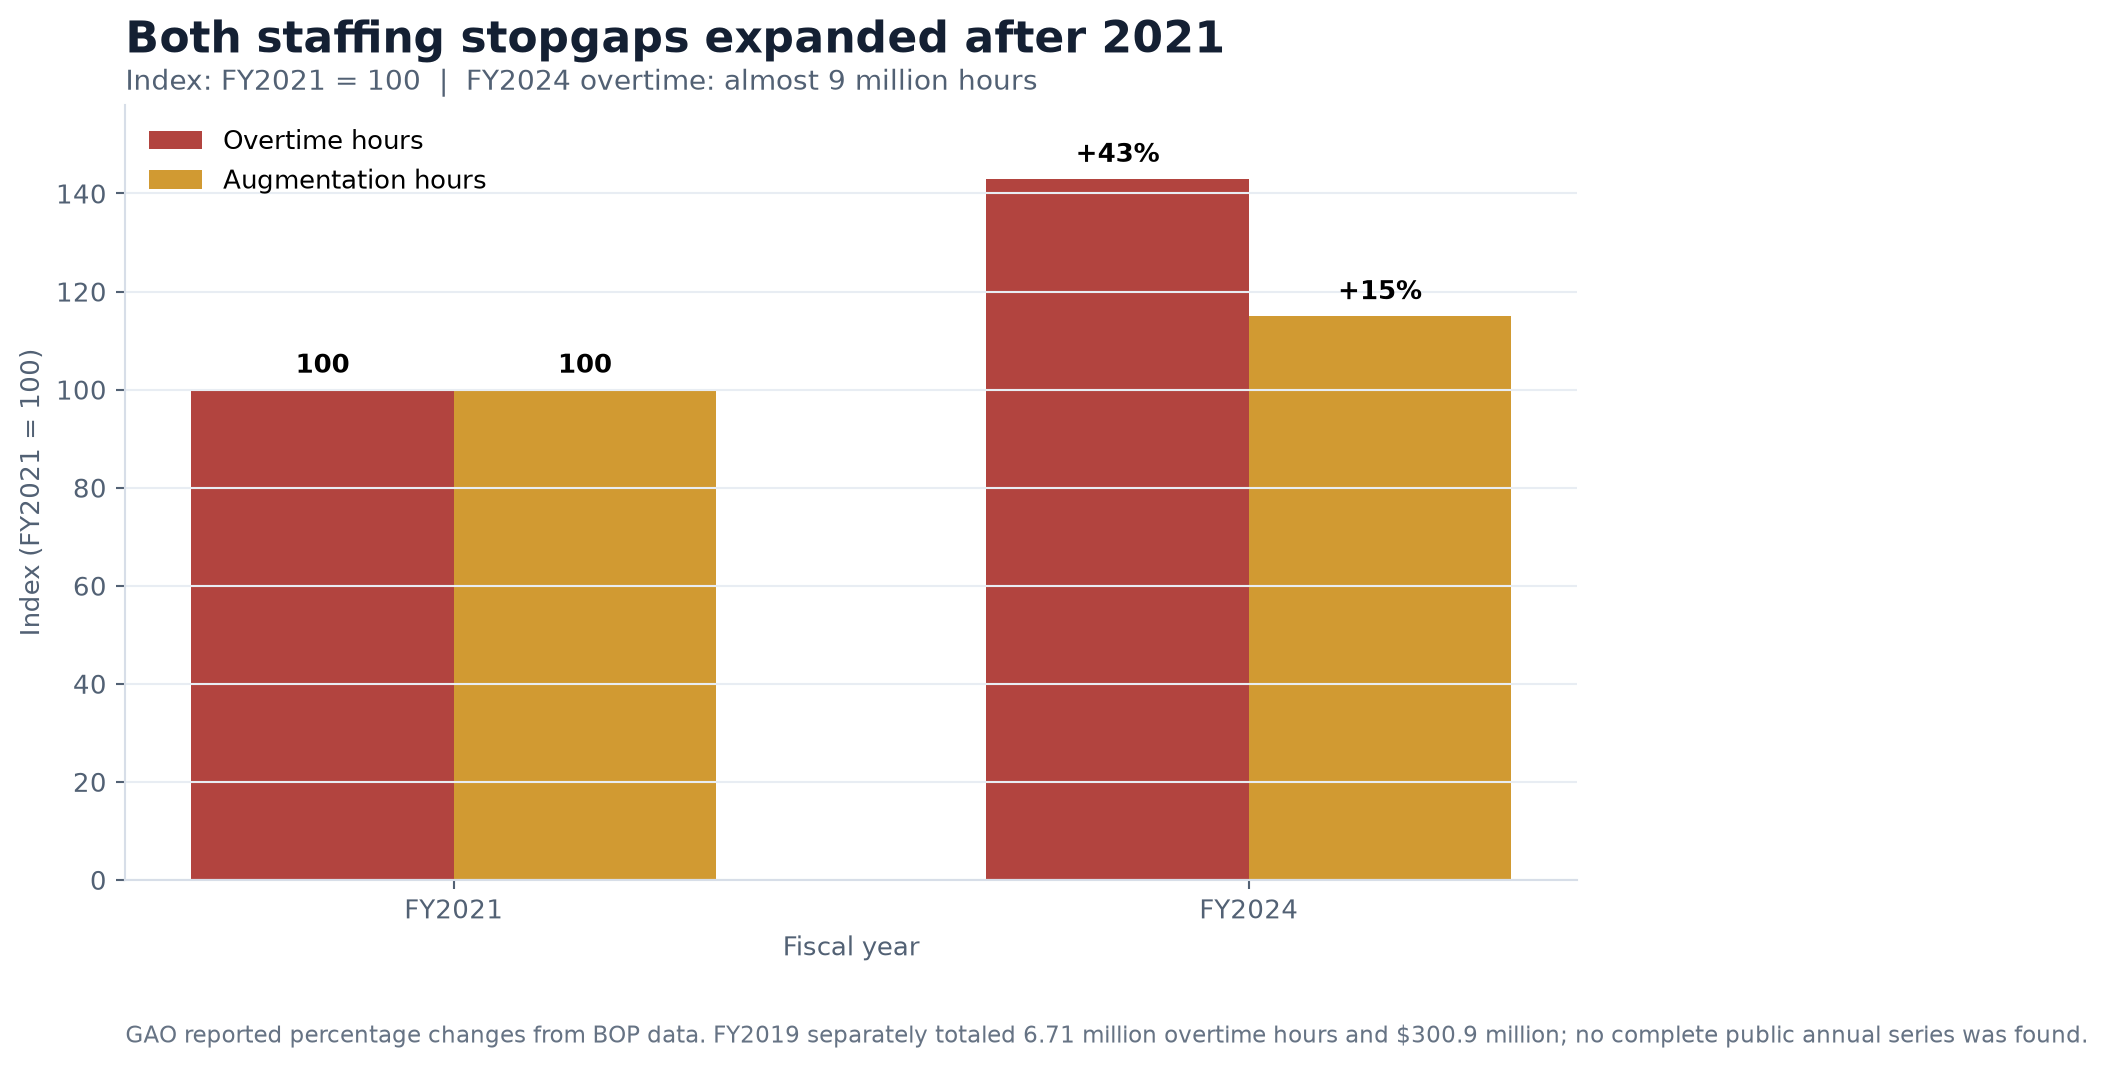
Overtime is paid labor, not an empty post. Augmentation also puts a trained BOP employee on a security assignment. Both can be necessary. Neither is equivalent to adding durable staffing.
With augmentation, the tradeoff is visible: the prison covers a correctional post by pulling someone from another job. DOJ OIG inspections have documented teachers losing program time, maintenance work being delayed and healthcare staff facing pressure in already thin departments. BOP employees are generally considered correctional workers first, but their regular occupations do not vanish during the reassignment.
GAO's 2021 recommendation called for a risk assessment of overtime and augmentation. A contractor's 2022 study found few risks in limited available data, though it found a correlation between overtime and sick leave and absence without leave. BOP later acknowledged that additional risks likely existed. As of the latest GAO update, the recommendation remained open because BOP had not fully documented what actions it would take in response. Officials told GAO that the fundamental correctional-officer shortage prevented full resolution.
One prison shows why funded vacancies can understate the gap
FCI Tallahassee offers a bounded example of how the accounting can break down.
At the time of a 2023 inspection, its Correctional Services Department reported 109 filled positions and 13 vacancies, or 89% staffing. That could sound close to full.
The OIG inspection found that overtime and augmentation had covered nearly 67,000 hours of correctional-post work during the preceding year, equivalent to about 32 full-time positions. The stopgap workload was more than twice the institution's official vacancy count.
OIG did not conclude that every one of those hours should become a new permanent job. It concluded that even filling the 13 vacancies might not allow the institution to operate both its women's prison and male detention center without continued overtime or augmentation. Institution leaders told inspectors that the authorized complement itself could be too low.
The operational tradeoffs were concrete. A facilities manager said reassignment to correctional posts delayed maintenance at an institution already facing major infrastructure problems. Staff also described mandatory overtime's effects on morale and personal obligations.
More recent inspections show the pattern was not confined to Tallahassee. At FDC SeaTac, inspected in December 2024, correctional services was staffed at 69% and health services at 50%. Only three of nine nursing positions were filled, and the clinical director position had been vacant for at least 18 months. OIG linked those shortages to exhausted employees, limited housing capacity, delayed healthcare and incomplete monitoring rounds.
In May 2026, GAO reported that employees at all four facilities it visited identified inadequate staffing coverage as a challenge in preventing and responding to sexual abuse. Officials also reported an investigator shortage that could slow investigations. These findings do not prove every BOP institution has the same conditions. They show that operational consequences persisted after the 2024 recruiting gain.
BOP kept recruiting for the same work
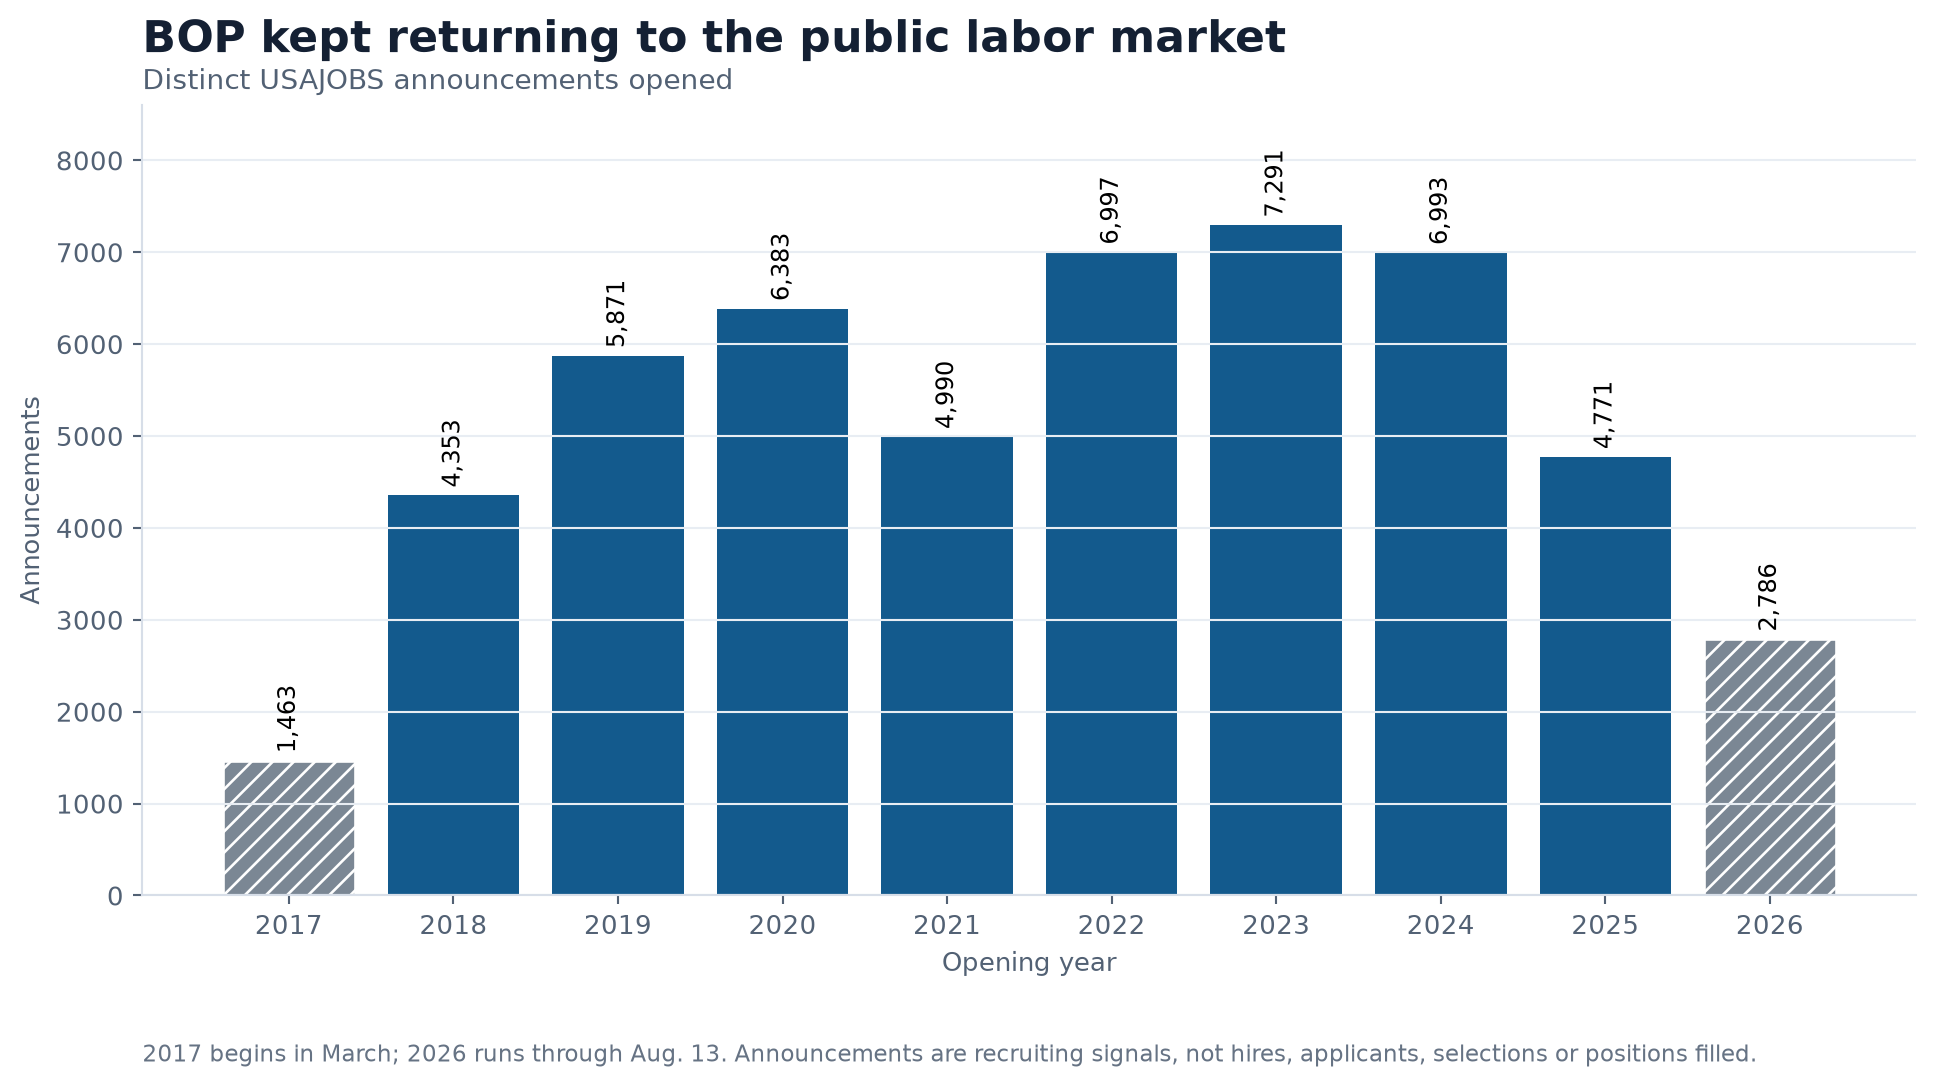
The FederalHiringData historical USAJOBS archive contains 51,898 distinct BOP announcements opened from March 2017 through Aug. 13, 2026. Correctional Officer was the largest occupational series, with 4,679 announcements. Correctional Institution Administration, Psychology, Social Science, Human Resources, nursing, health technicians and maintenance occupations also appeared repeatedly.
Related research
Put this finding in context

Data investigationsAugust 21, 2026
National Park Visits Rose 13%. September Staffing Fell 17%.
The park system still builds a summer workforce, but same-month OPM data show a thinner permanent base beneath 323 million annual visits.

Data investigationsAugust 20, 2026
Federal Fire Staffing Rebounded in 2026. All of the Net Gain Came From Nonpermanent Appointments.
Interior built a new wildland fire service, but the Forest Service has not joined it. Federal records show the 2026 staffing rebound came entirely from nonpermanent appointments.
Announcements are not hires. One announcement can advertise multiple openings, name multiple locations or create a standing register. The archive does not show how many people applied, were selected, entered on duty or remained.
It does show recurring demand. Among correctional-officer announcements tied to named locations, Beaumont, Texas; Thomson, Illinois; and Bruceton Mills, West Virginia, each appeared in 87 distinct announcements across nine opening years. Yazoo City, Mississippi; Florence, Colorado; Coleman, Florida; and Butner, North Carolina, also recurred across nine years.
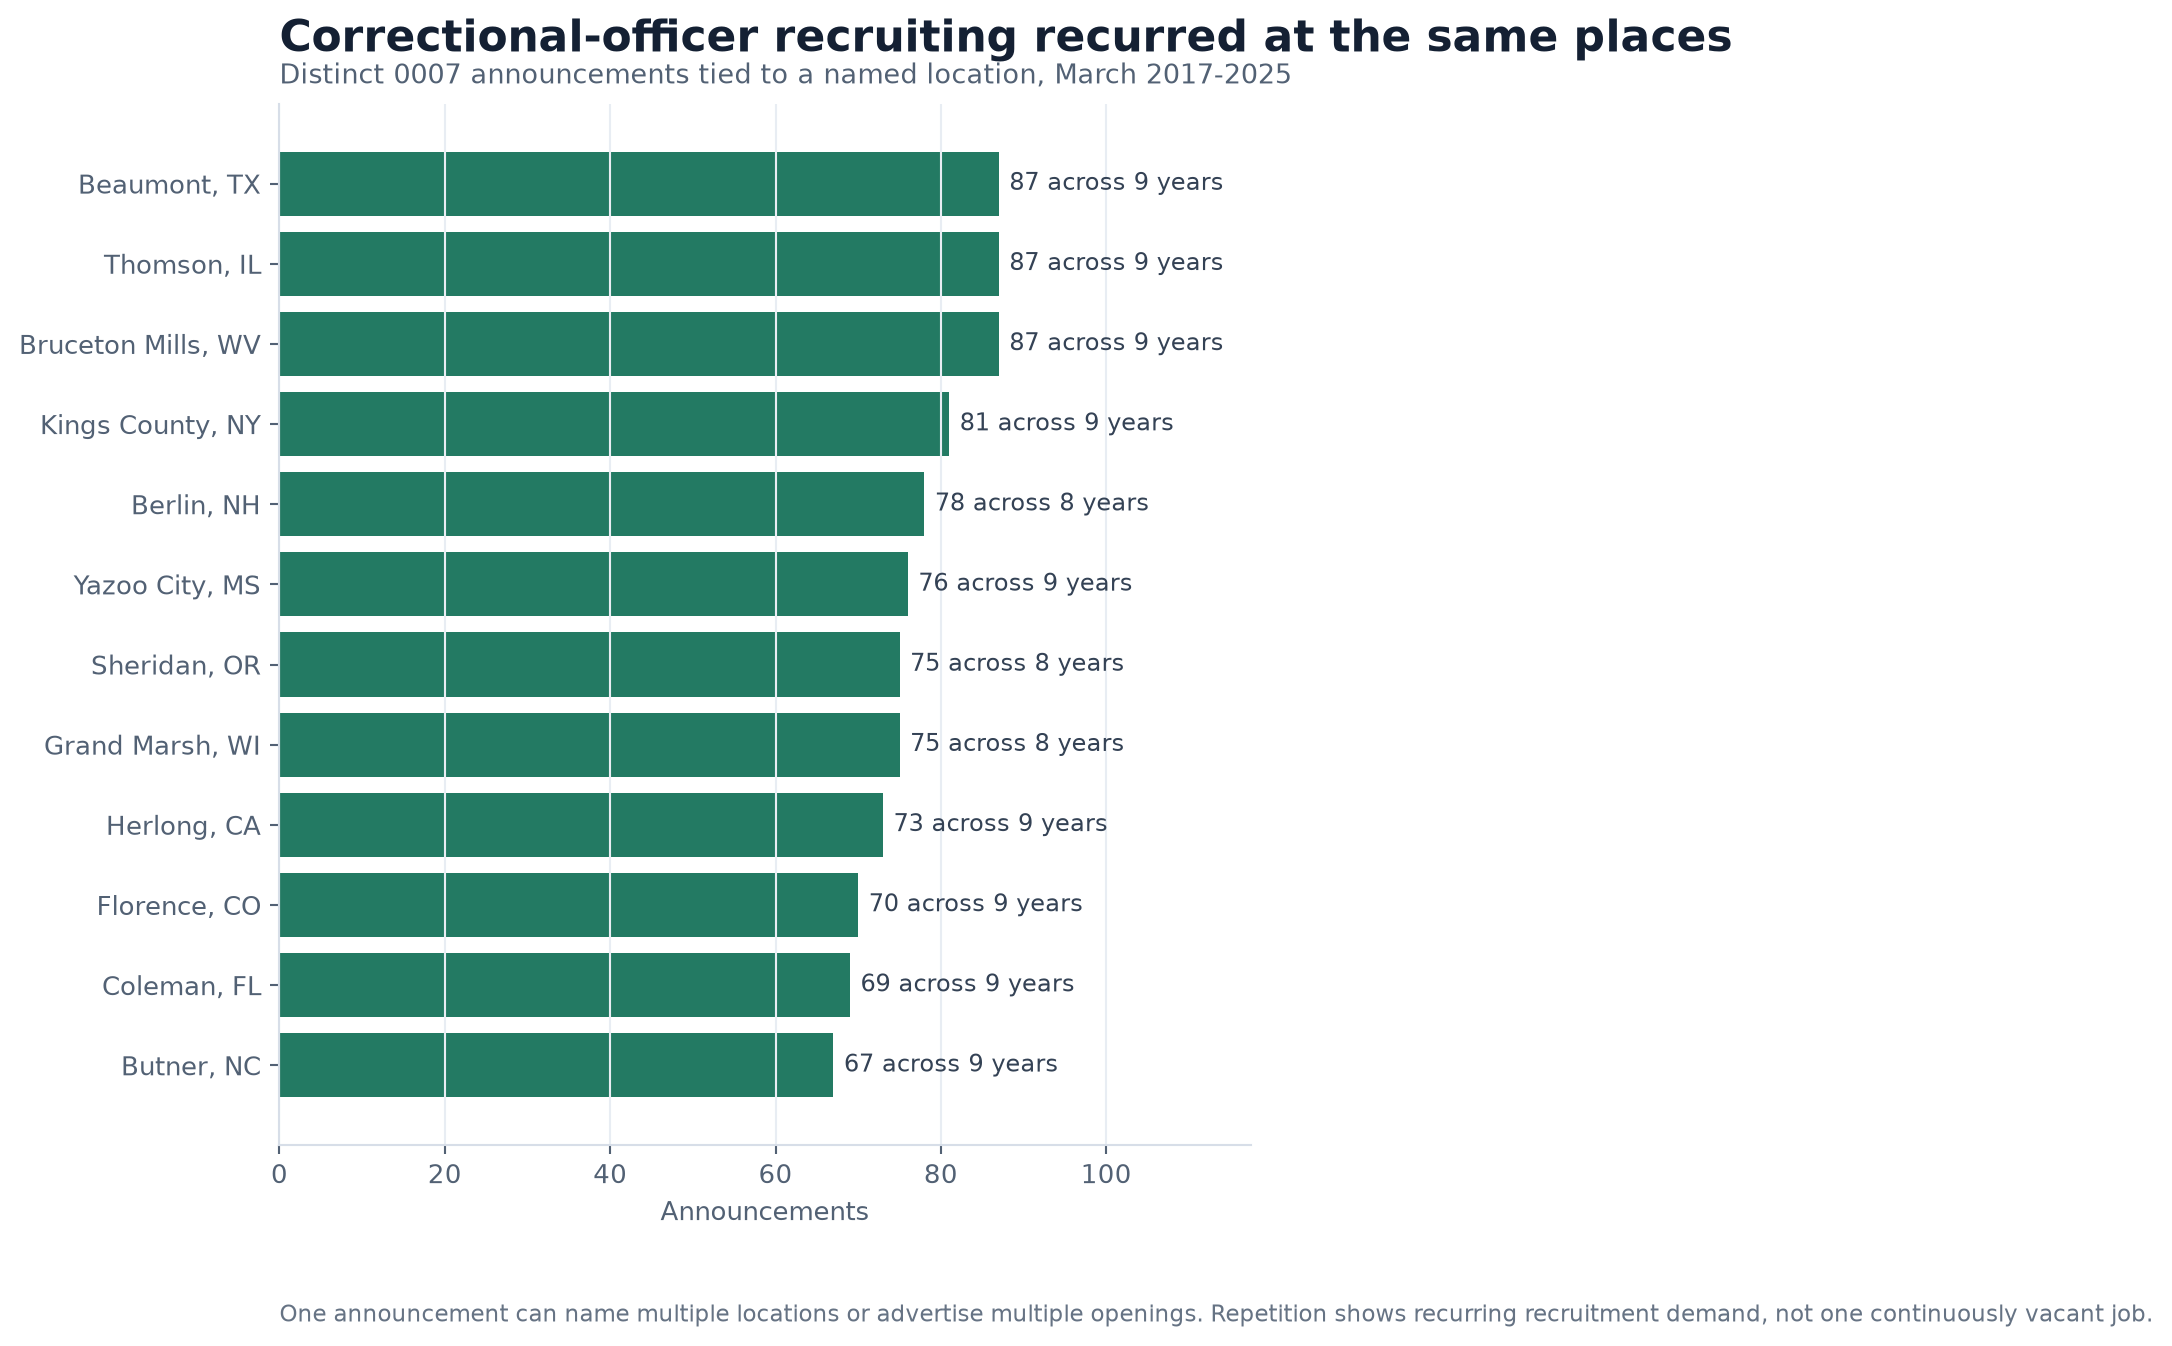
Several of those same places appeared on OIG's list of the 19 BOP locations with the most overtime in fiscal 2019, including Beaumont, Yazoo City, Florence, Coleman and Butner. That overlap does not prove one announcement corresponded to one overtime shift. It strengthens the narrower conclusion that recruiting pressure and overtime pressure repeatedly surfaced in some of the same institutional markets.
BOP has changed the offer. It used direct-hire authority, relaxed the maximum entry age for some applicants and deployed recruitment, retention and relocation incentives. OPM's 2026 law-enforcement special-rate initiative included BOP correctional officers; special salary rates count as basic pay for most purposes, including overtime and percentage-based incentives. BOP's current careers site advertises incentives of up to 50% of salary for certain hard-to-fill positions.
Those pay tools work at more than one stage of the staffing problem. A recruitment incentive can help turn an applicant into a new hire. A retention incentive can make departure less attractive. A higher special rate also raises the base used to calculate overtime, so the price of covering a shortage can rise along with the offer intended to reduce it. The public records reviewed here do not isolate the number of officers who joined or stayed because of any one measure.
That makes the most recent monthly headcount especially important. A two-month gain is consistent with recruitment beginning to work, but it cannot yet distinguish a durable retention improvement from a burst of entries before later attrition. A stronger test would require several more OPM observations, institution-level vacancy and coverage measures, and a decline in overtime or augmentation that occurs without sacrificing required posts.
Congress also supplied a longer runway. The DOJ Inspector General reports that legislation enacted in July 2025 provided BOP $5 billion through September 2029, including $3 billion for hiring and training correctional officers, medical professionals, maintenance employees and support staff.
Those measures improve BOP's ability to compete. The April-to-June officer gain may be an early result. But neither an incentive nor an announcement is an employee retained through training and multiple years of prison work. GAO's recommendation that BOP measure incentive outcomes remained only partially addressed in its latest update.
Contractors do not complete the explanation either. Contractors helped BOP design its staffing and risk tools, and OIG has documented outside medical providers filling some clinical-service gaps. No public systemwide series reviewed here measures contractor workers replacing correctional officers or quantifies a one-for-one transfer of prison operations. That part of the staffing ledger remains unknown.
A small rebound, not a solved shortage
BOP is not back where it was in April. It added officers in May and June, has new special rates and incentives, and has funding intended to support hiring and training. The inmate population is also far below its 2013 peak. Those are substantial counterweights to the bleakest reading of the record.
The case for recovery remains incomplete. BOP had fewer total employees and fewer correctional officers in June 2026 than in January 2025. Nurses, physicians, psychologists and selected operational occupations also contracted. The latest national overtime and augmentation figures moved upward, while recent inspections continued to find prisons where stopgaps displaced other work or failed to cover all needs.
The next test is not another announcement count. It is whether BOP's spring staffing gain persists, whether institution-level coverage improves, and whether overtime and augmentation fall as permanent staffing rises. Until those measures move together, the system can show that posts were covered. It cannot yet show that the backstop is no longer necessary.
Readers can browse current federal jobs, compare agency data, explore federal workforce statistics and read more FederalHiringData investigations.
Methodology and limitations
Workforce: FederalHiringData queried OPM FedScope legacy employment snapshots and OPM Federal Workforce Data for BOP subelement DJ03. The long-run total uses September observations from 1998 through 2025 and June 2026 as the latest point. The occupational analysis uses monthly OPM records from January 2015 through June 2026. OPM covered-employment totals can differ from BOP internal employee counts.
Population: Annual totals come from BOP's official population history. The 2026 total was updated Aug. 20. Annual ratios pair September workforce and fiscal-year population totals; the 2026 context ratio pairs June staffing with the Aug. 20 population. These ratios are context, not productivity or a staffing-adequacy standard.
Shortages and operating measures: The 9,500 correctional-officer and 3,000 medical-professional estimates are preserved as BOP estimates reported by GAO in its 2025 High-Risk update. They are not presented as current vacancies. FY2019 overtime comes from DOJ OIG payroll analysis. FY2021-to-FY2024 overtime and augmentation changes come from GAO's recommendation tracker. A complete public annual series was not located, so missing years were not estimated.
Recruiting: USAJOBS analysis uses distinct control numbers in the FederalHiringData historical USAJOBS archive. Coverage begins around March 2017 and runs through Aug. 13, 2026 for this analysis. Announcements are not hires, applicants, selections or positions filled. Location counts can include one control number in multiple places. Repeated announcements indicate recurring recruitment demand, not one continuously vacant position.
Image: The hero is an official DOJ OIG photograph of a security camera at a BOP institution, posted in a BOP-cleared transparency gallery. It provides institutional context and does not depict a specific staffing shortfall.
Continue reading
More from FederalHiringData
Data investigationsAugust 19, 2026
Social Security Has 85% More Beneficiaries per Worker Than in 2000
Social Security added 25 million beneficiaries while losing 9,600 full-time permanent workers. Recent service gains show what technology changed—and what a thinner workforce still risks.

Data investigationsAugust 18, 2026
Federal FOIA Backlog Hit 339,671 as DHS Carried Nearly Half
The federal FOIA backlog rose 27% in fiscal 2025. DHS held 168,505 pending requests while request volume grew and two different public staffing measures moved downward.

Data investigationsAugust 21, 2026
VHA's Federal Workforce Fell by 28,342. Its Care Forecast Kept Rising.
VA's health workforce contracted after late 2024 even as patient, visit and community-care demands remained large. The losses reached clinical and coordinating roles.
Federal Hiring Data Weekly
Get the biggest federal workforce changes in your inbox.
Subscribe to Federal Hiring Data Weekly for federal hiring trends, salary data, agency movements, and original investigations, with email confirmation before delivery.