August 21, 2026
VHA's Federal Workforce Fell by 28,342. Its Care Forecast Kept Rising.
VA's health workforce contracted after late 2024 even as patient, visit and community-care demands remained large. The losses reached clinical and coordinating roles.
By Evan Mercer
Published August 21, 2026Last edited August 21, 2026

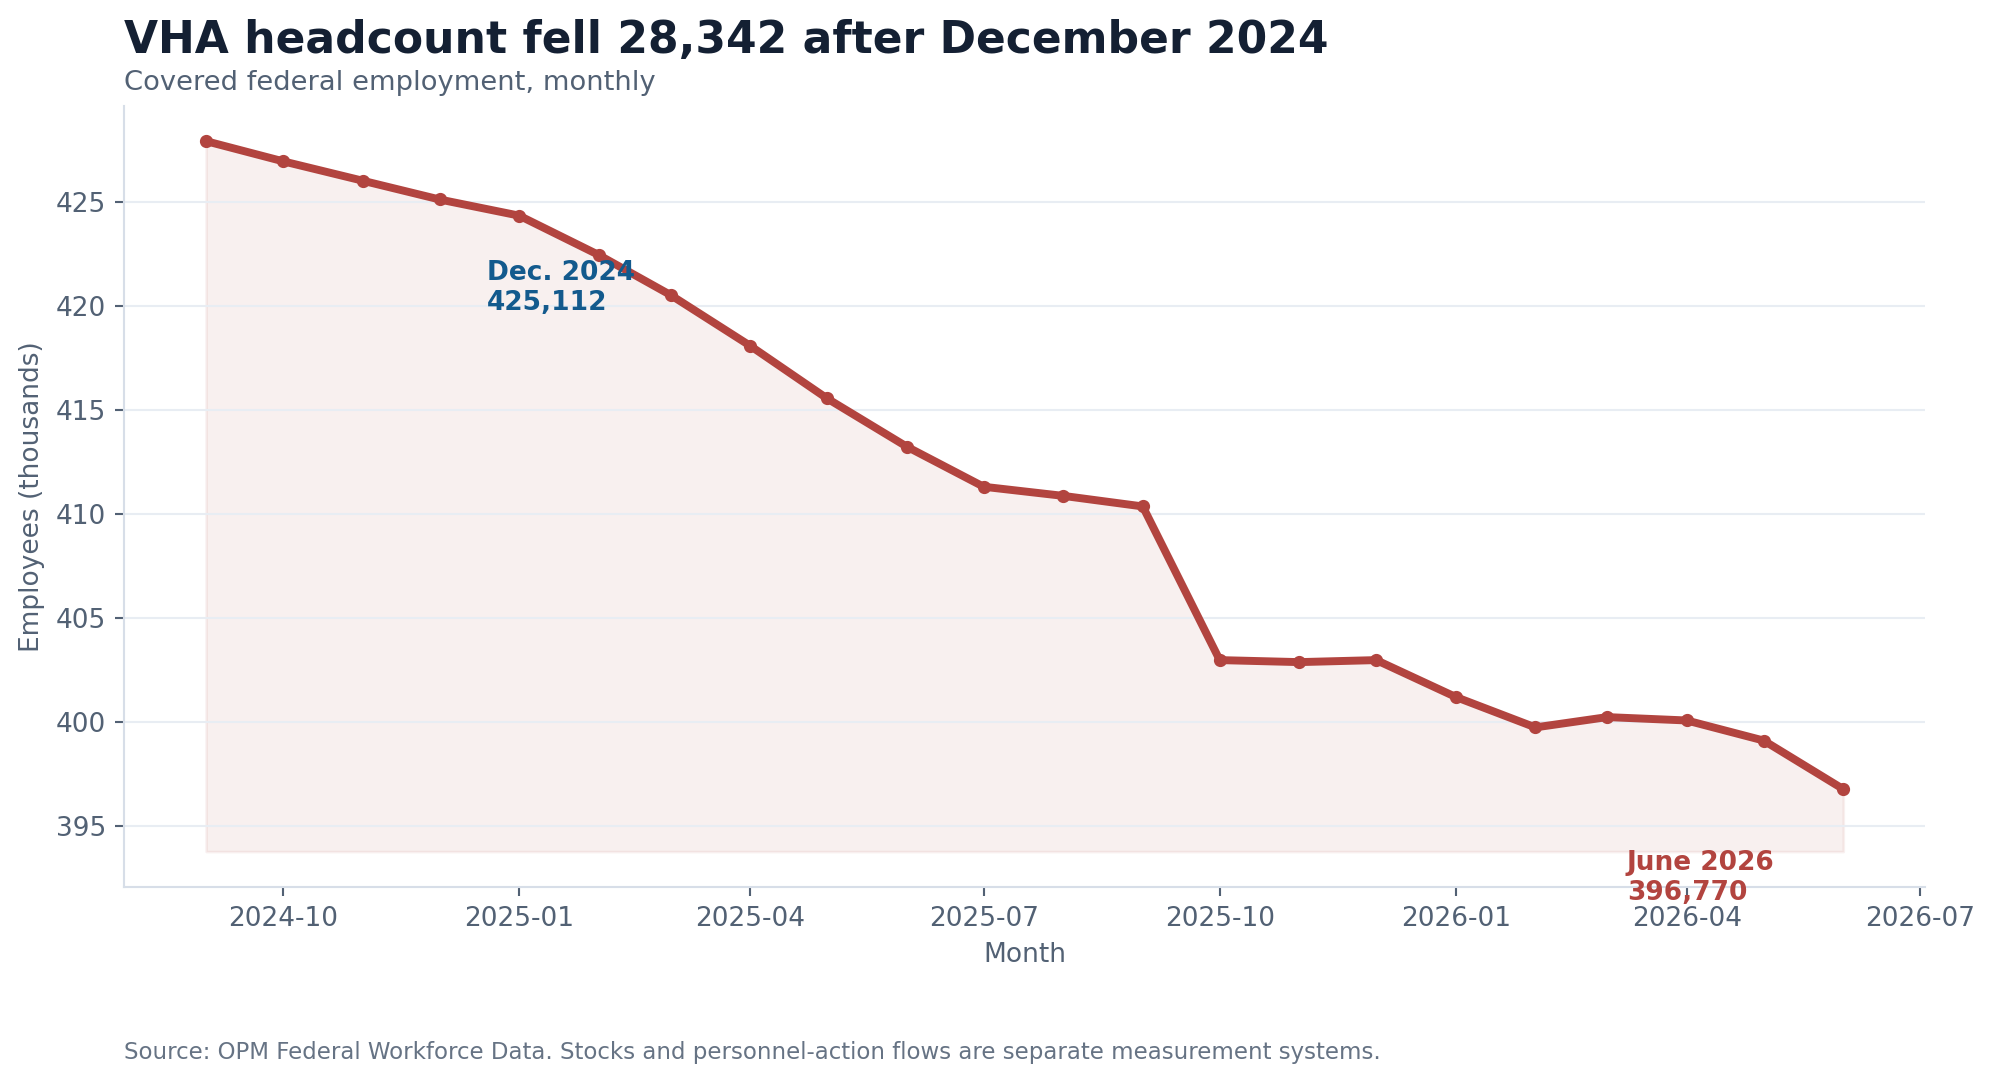
The Veterans Health Administration entered mid-2026 with 396,770 covered federal employees, according to the Office of Personnel Management. That was 28,342 fewer than in December 2024, a decline of 6.7% in 18 months.
The care outlook did not point toward an equivalent reduction in work. The Department of Veterans Affairs' fiscal 2026 budget publication projected 7.70 million unique patients and 162.6 million outpatient visits in 2026, up from its published 2024 figures of 7.33 million patients and 145.2 million visits. Those 2026 numbers are planning estimates, not observed results. They nevertheless show that VA was budgeting around more care, not less.
The change reached the occupations patients encounter and the people who keep care moving. From January 2025 through June 2026, VHA lost 2,673 nurses, 1,938 medical officers, 1,368 social workers, 792 medical support assistants, 442 nursing assistants, 439 psychologists and 258 pharmacists in selected OPM series. Human resources specialists fell by 1,489.
This is not evidence that veterans lost access to the same number of clinicians. OPM counts federal employees, not contract physicians, medical trainees or community providers paid by VA. It also does not prove that staffing reductions caused a particular wait time or health outcome. Those questions require operational measures that the public workforce files do not contain.
But the federal capacity change is real. It occurred while VA continued to serve about 9.1 million enrolled veterans, community care expanded and the department forecast more outpatient activity. Understanding what happened requires keeping three things separate: the Department of Veterans Affairs, the Veterans Health Administration that runs and finances health care, and the much wider network of non-federal clinicians that also treats veterans.
A 25-year expansion reversed after 2024
VHA's federal workforce more than doubled between 2000 and 2024. OPM's comparable September snapshots rose from 202,220 employees in 2000 to 427,915 in 2024. Growth accelerated after 2007 and continued through the pandemic era.
That long expansion turned downward after 2024. September 2025 headcount was 410,359, 17,556 below the prior September. The latest monthly OPM observation, June 2026, stood at 396,770.
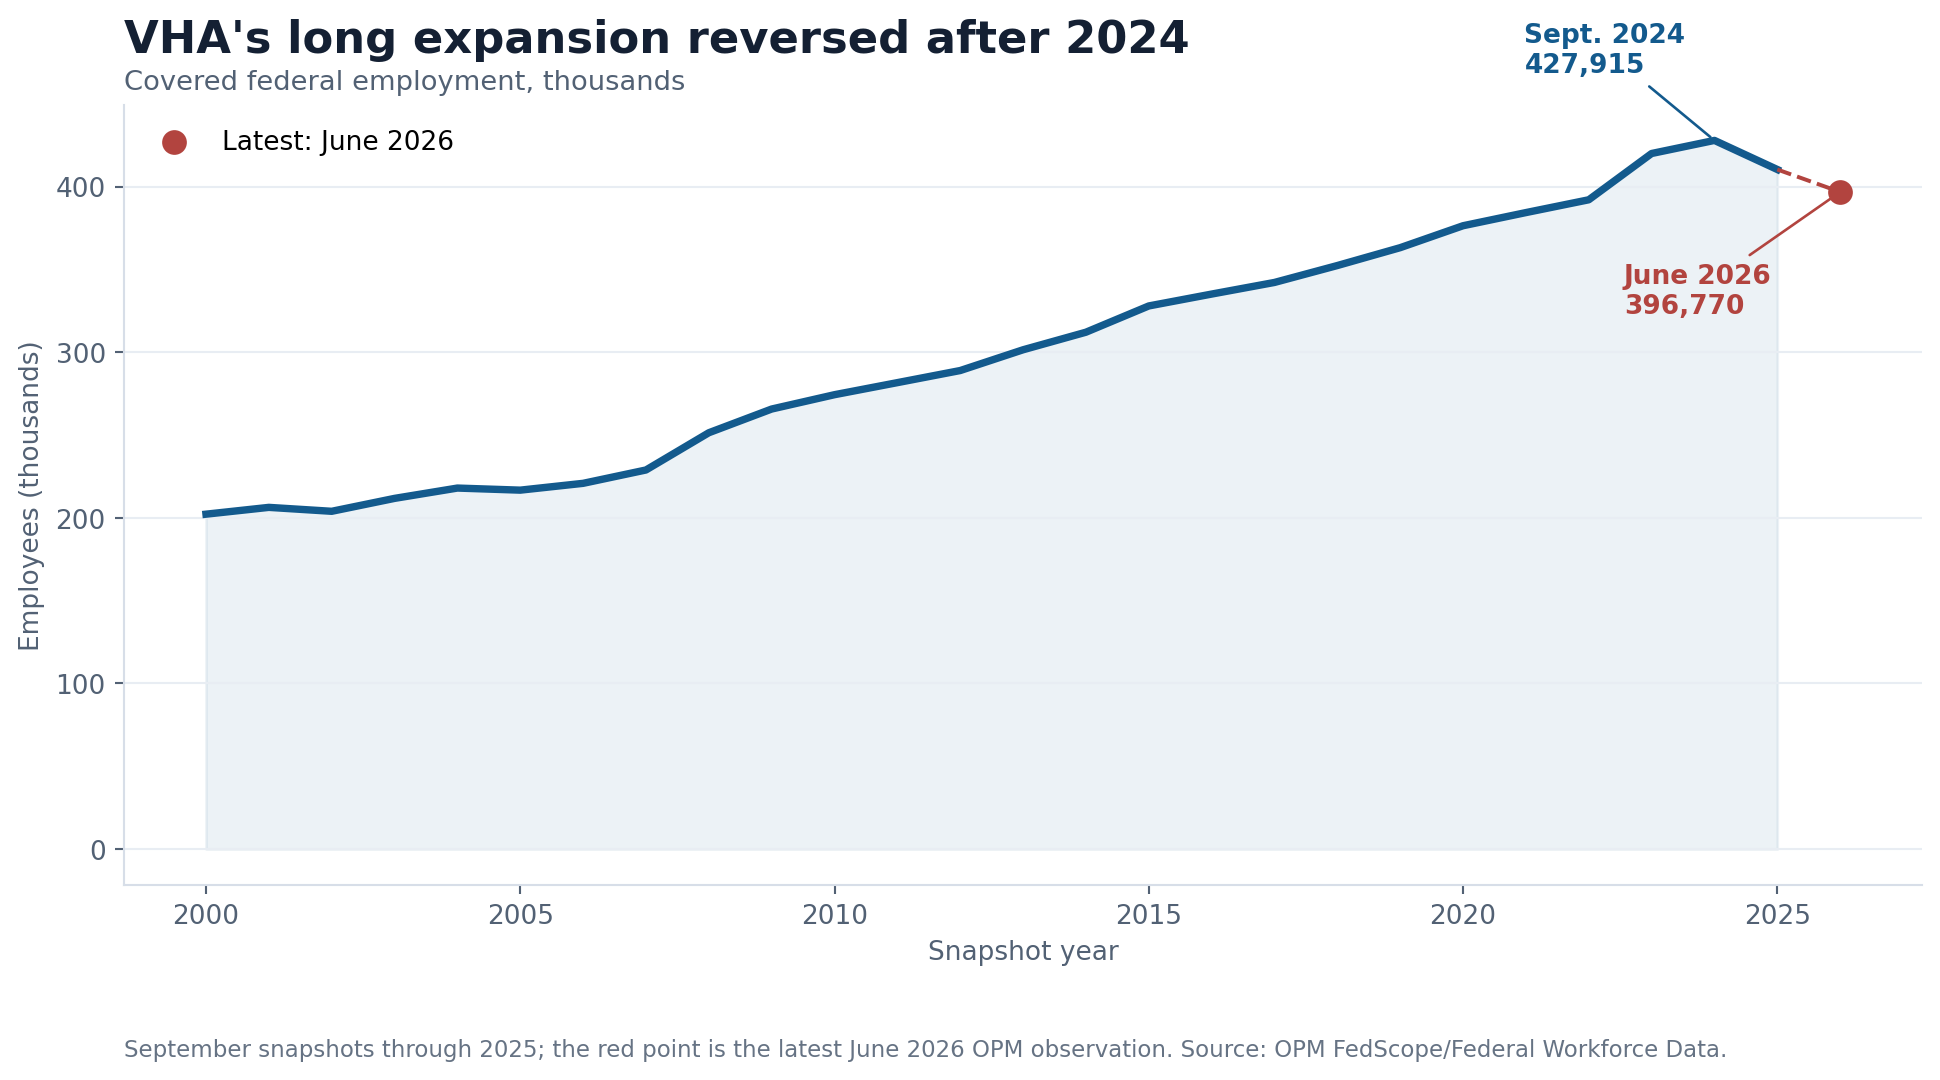
The historical context matters. June 2026 VHA employment was still 33,624 higher than in September 2019, an increase of 9.3%. The recent contraction gave back part of the post-2019 expansion; it did not erase it.
| Workforce checkpoint | VHA covered employees | Change from prior checkpoint |
|---|---|---|
| September 2000 | 202,220 | - |
| September 2010 | 274,368 | +72,148 |
| September 2019 | 363,146 | +88,778 |
| September 2024 | 427,915 | +64,769 |
| September 2025 | 410,359 | -17,556 |
| June 2026 | 396,770 | -13,589 from September 2025 |
These are covered federal employees assigned to VHA in OPM data. They are not the department's total workforce. The Veterans Benefits Administration, National Cemetery Administration and VA staff offices carry different missions and are not mixed into this series.
The losses reached clinical and coordinating roles
The most recent monthly path was not a single abrupt correction. Headcount moved from 425,112 in December 2024 to 418,101 in April 2025, 410,335 in September and 396,770 in June 2026. There were brief pauses and small increases, but the overall direction persisted.
OPM personnel-action files reinforce that direction without exactly reproducing the stock change. They contain 45,532 VHA accession actions and 64,299 separation actions from January 2025 through June 2026. Separations exceeded accessions in 15 of the 18 months.
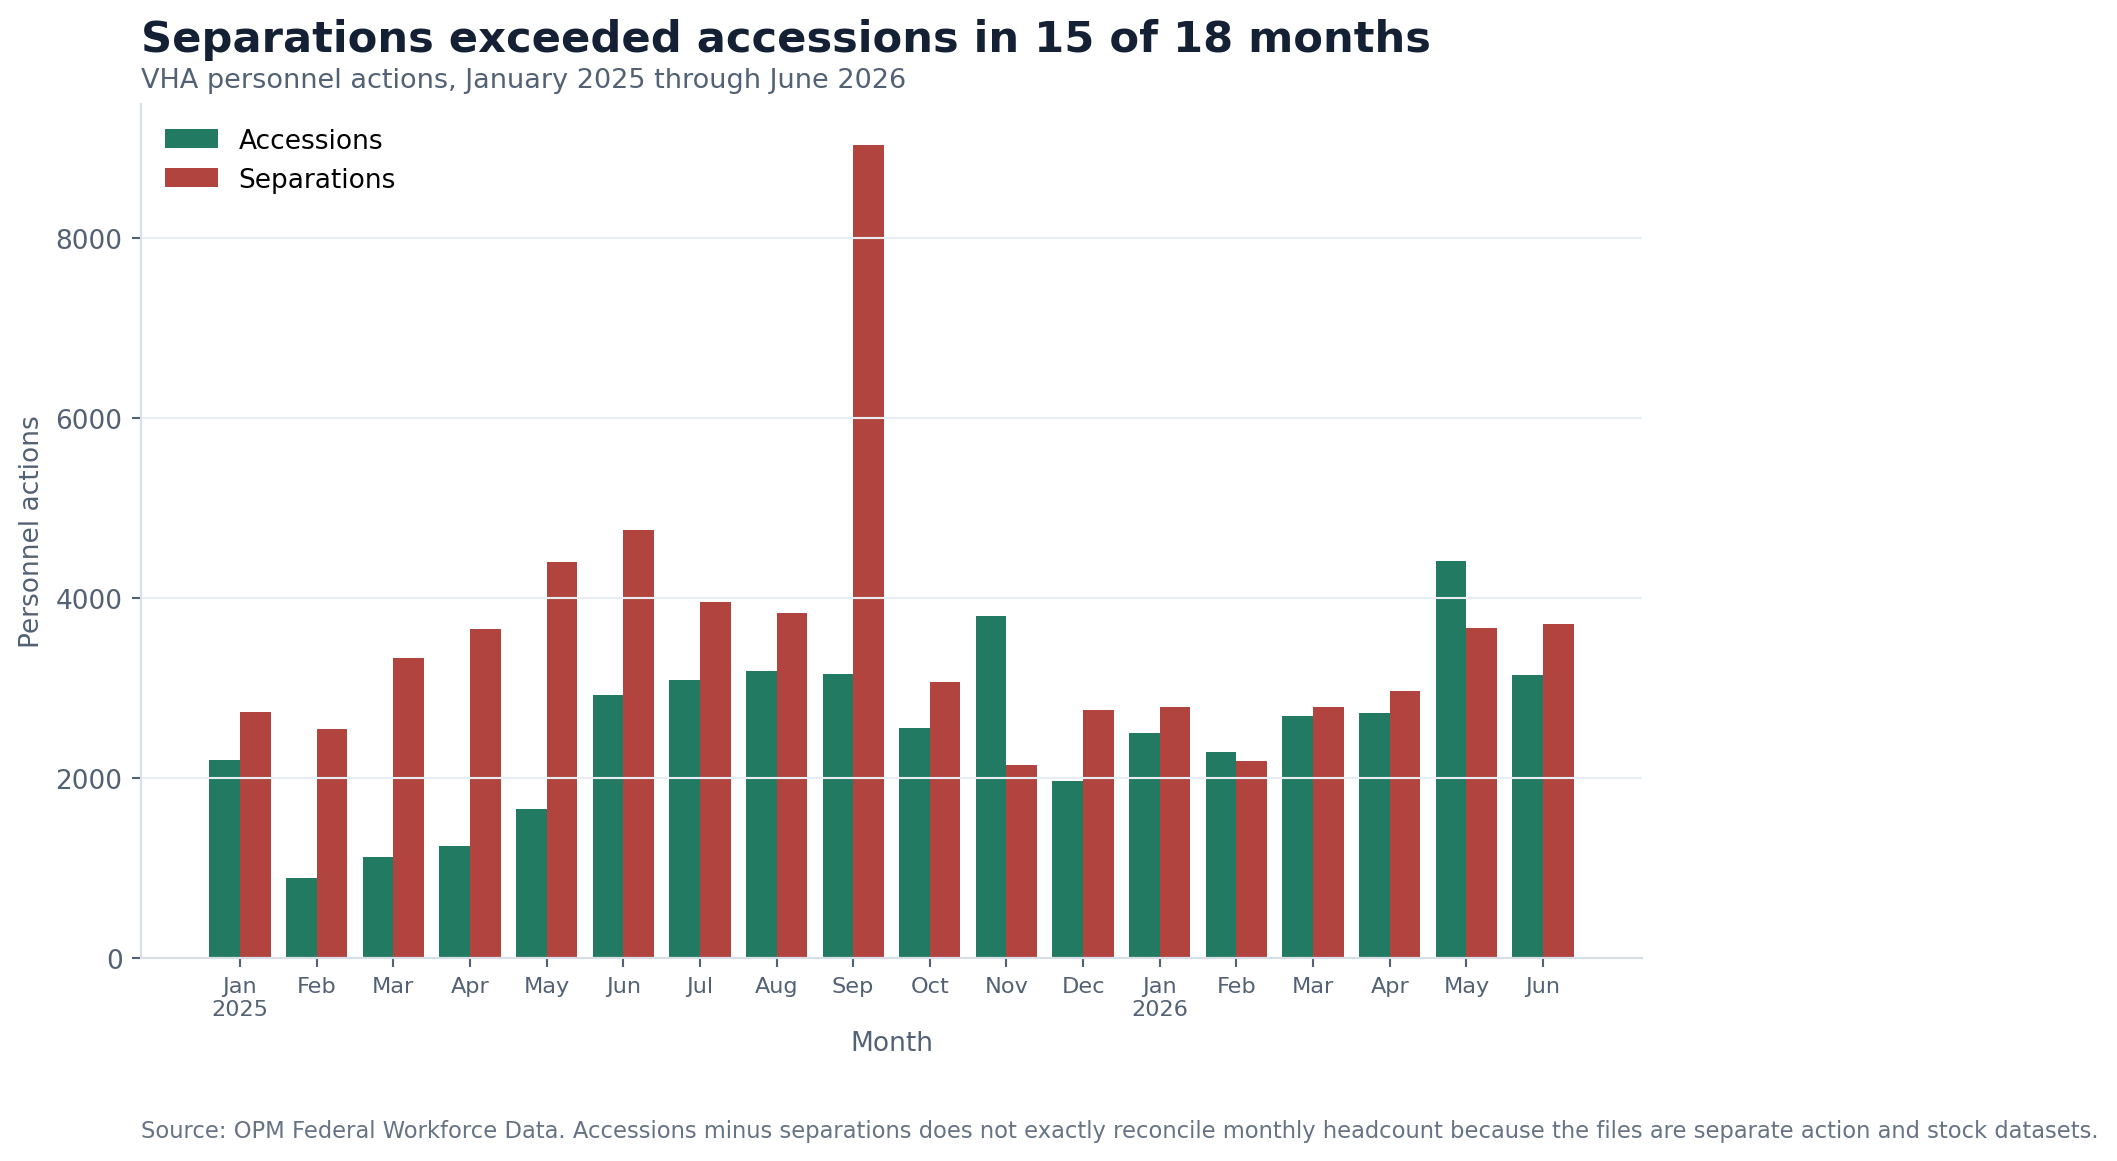
Personnel actions and monthly headcount are separate OPM datasets. Transfers, corrections, effective dates and coverage rules mean subtracting one flow from another will not produce the exact stock change. The action records are best read as corroborating evidence of sustained net outflow, not as an alternate headcount.
The occupational detail shows that the decline was not confined to administration.
| Selected VHA occupation | January 2025 | June 2026 | Change | Percent change |
|---|---|---|---|---|
| Nurses | 94,353 | 91,680 | -2,673 | -2.8% |
| Medical officers | 30,340 | 28,402 | -1,938 | -6.4% |
| Human resources | 8,171 | 6,682 | -1,489 | -18.2% |
| Social workers | 21,665 | 20,297 | -1,368 | -6.3% |
| Medical support assistants | 36,575 | 35,783 | -792 | -2.2% |
| Nursing assistants | 14,136 | 13,694 | -442 | -3.1% |
| Psychologists | 8,390 | 7,951 | -439 | -5.2% |
| Pharmacists | 12,703 | 12,445 | -258 | -2.0% |
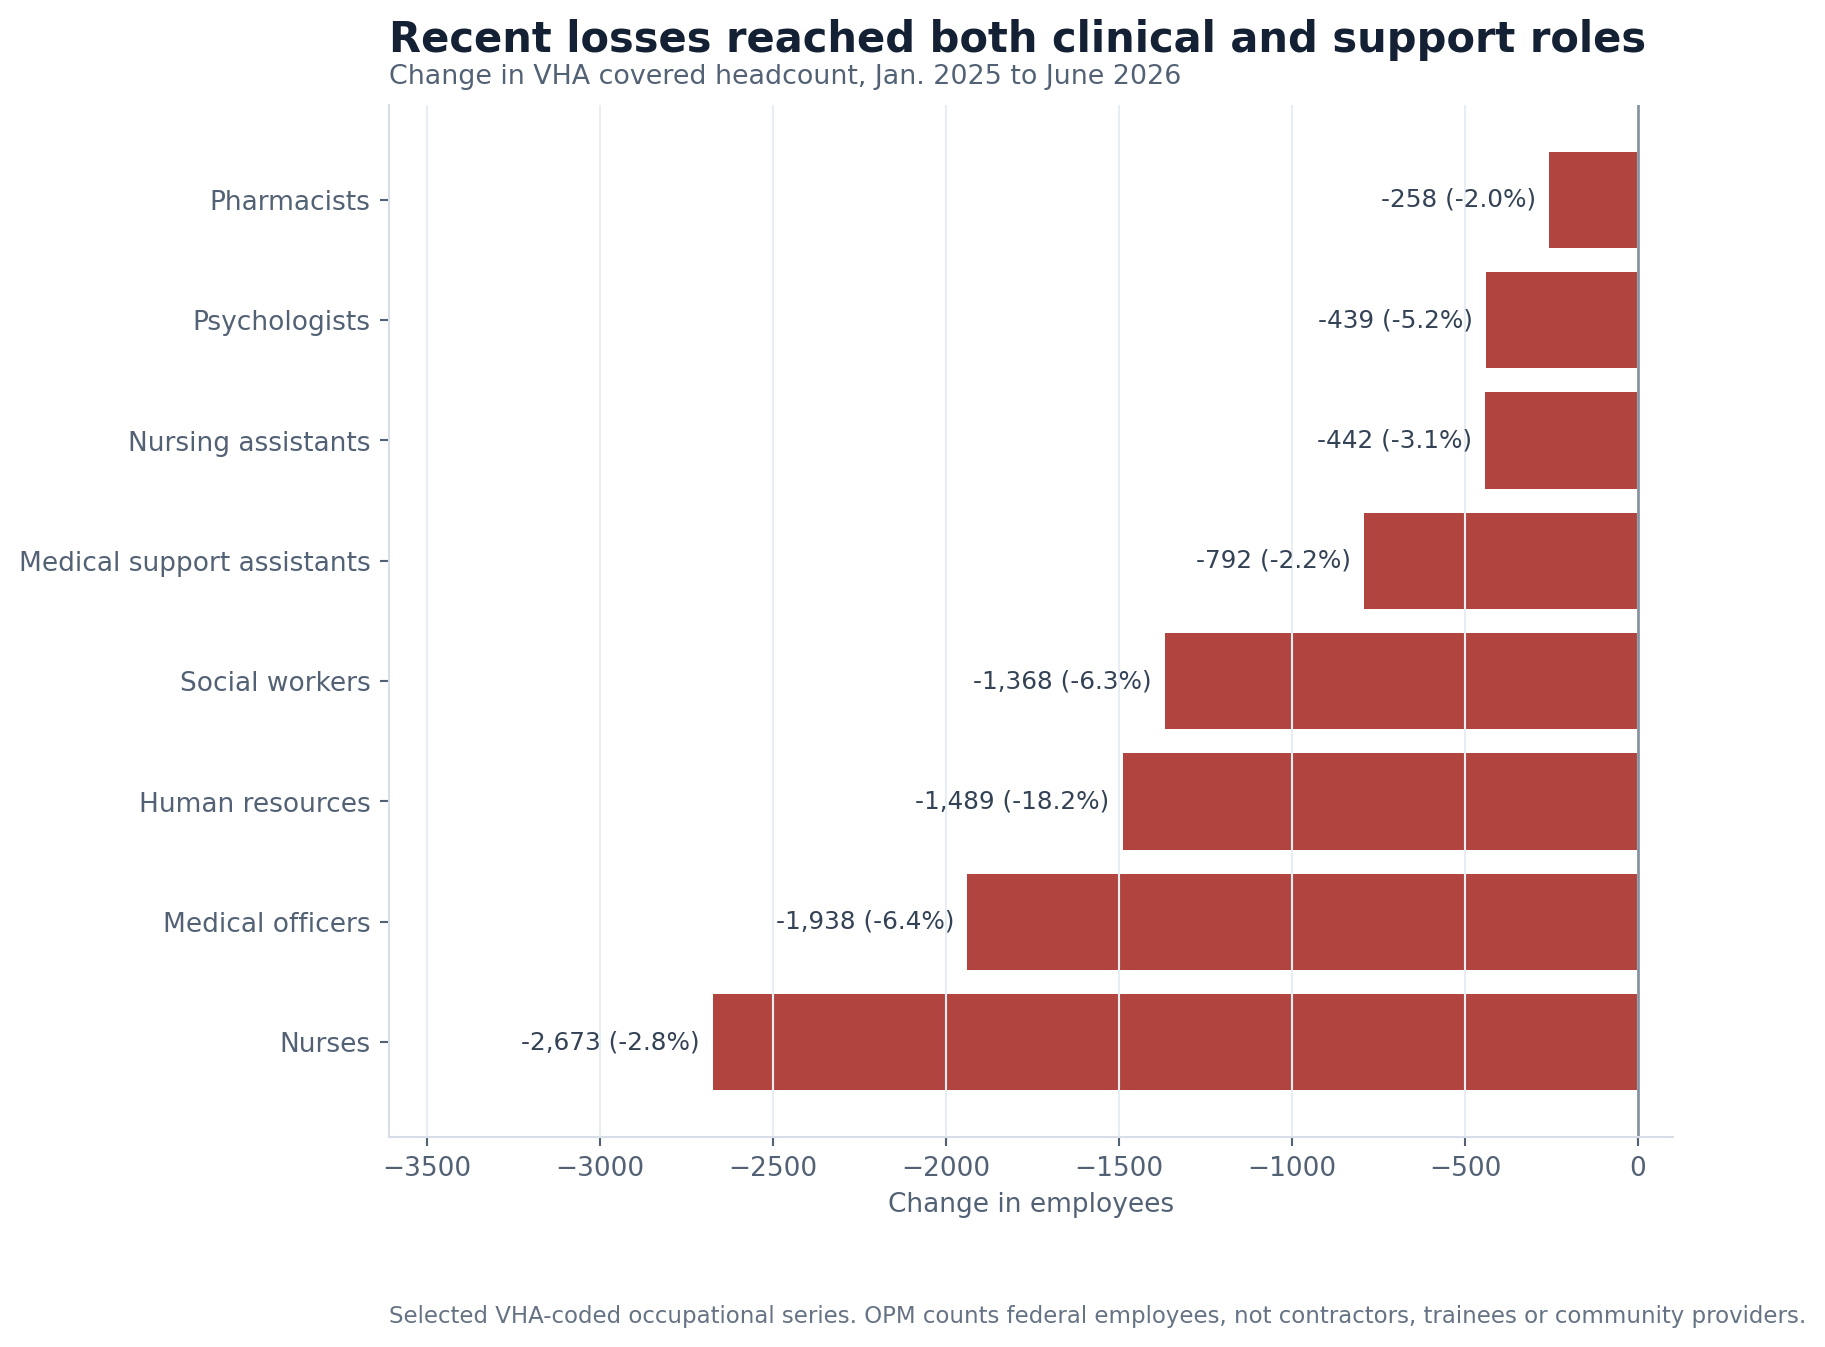
The counts describe federal positions, not services delivered. A smaller psychologist series does not establish that a veteran missed an appointment, and a smaller medical support assistant series does not quantify scheduling delays. The composition still matters because health care depends on more than the clinician in the examination room. Nurses, social workers and pharmacists deliver care; support assistants route calls and appointments; human resources staff recruit and onboard the workforce.
Some apparent occupational collapses were deliberately excluded. VA centralized information technology and contracting work in department-level organizations over time. A coded drop inside VHA may therefore represent a transfer of work rather than its elimination. The analysis focuses on occupational series that remained meaningfully attached to the VHA subelement.
The longer comparison again provides a necessary limit. June 2026 still had 16,482 more nurses, 8,483 more medical support assistants, 4,292 more social workers and 2,327 more pharmacists than September 2019. Medical officers were 563 above that earlier level. Recent losses were broad, but several patient-care occupations remained substantially larger than before the pandemic.
The change was not limited to temporary appointments
Appointment tenure and work schedule provide two additional views of the contraction. They answer different questions and overlap. A permanent employee can be full time or part time, and a nonpermanent employee can also work full time. The categories should never be added together as separate groups.
In January 2025, VHA had 410,317 employees in OPM permanent appointment categories. By June 2026, that count had fallen to 386,377, a reduction of 23,940, or 5.8%. Nonpermanent appointment headcount fell from 13,980 to 10,386, a larger percentage decline of 25.7% from a much smaller base.
Full-time employment moved from 400,650 to 375,860 over the same span, a decline of 24,790, or 6.2%. Because full-time status overlaps with both appointment groups, that figure is another description of the workforce change rather than an additional loss.
| VHA workforce dimension | January 2025 | June 2026 | Change |
|---|---|---|---|
| Permanent appointment | 410,317 | 386,377 | -23,940 |
| Nonpermanent appointment | 13,980 | 10,386 | -3,594 |
| Full-time work schedule | 400,650 | 375,860 | -24,790 |
The appointment totals differ from the overall headcount by a few records because not every row can be placed in the two displayed appointment groups. That small residual does not affect the direction or scale of the comparison.
The composition matters because temporary hiring by itself could have made the total look smaller after a seasonal cycle. Here, both permanent and nonpermanent groups declined, and most of the numeric reduction was inside the much larger permanent workforce. The full-time series moved in the same direction.
These labels still do not measure experience, hours of direct patient care or which facility lost a particular skill. Nor does a permanent appointment guarantee that an employee stayed through the end of the period. The categories show that the contraction was broader than an expiration of temporary appointments, while stopping short of claiming which work went uncovered.
The workload did not shrink with the payroll
VA's health system serves about 9.1 million enrolled veterans, but enrollment is not the same as the number treated in a year. The department reported 6.44 million unique patients in fiscal 2019. Its fiscal 2026 Budget in Brief published a 2024 figure of 7.33 million and projected 7.70 million for 2026.
Outpatient activity has expanded over a much longer period. VA reported 46.5 million outpatient visits in 2002, 80.2 million in 2010 and 123.9 million encounters in 2019. Its budget document published 145.2 million for 2024 and projected 162.6 million in 2026.
Federal Hiring Data Weekly
Get the biggest federal workforce changes in your inbox.
Subscribe to Federal Hiring Data Weekly for federal hiring trends, salary data, agency movements, and original investigations, with email confirmation before delivery.
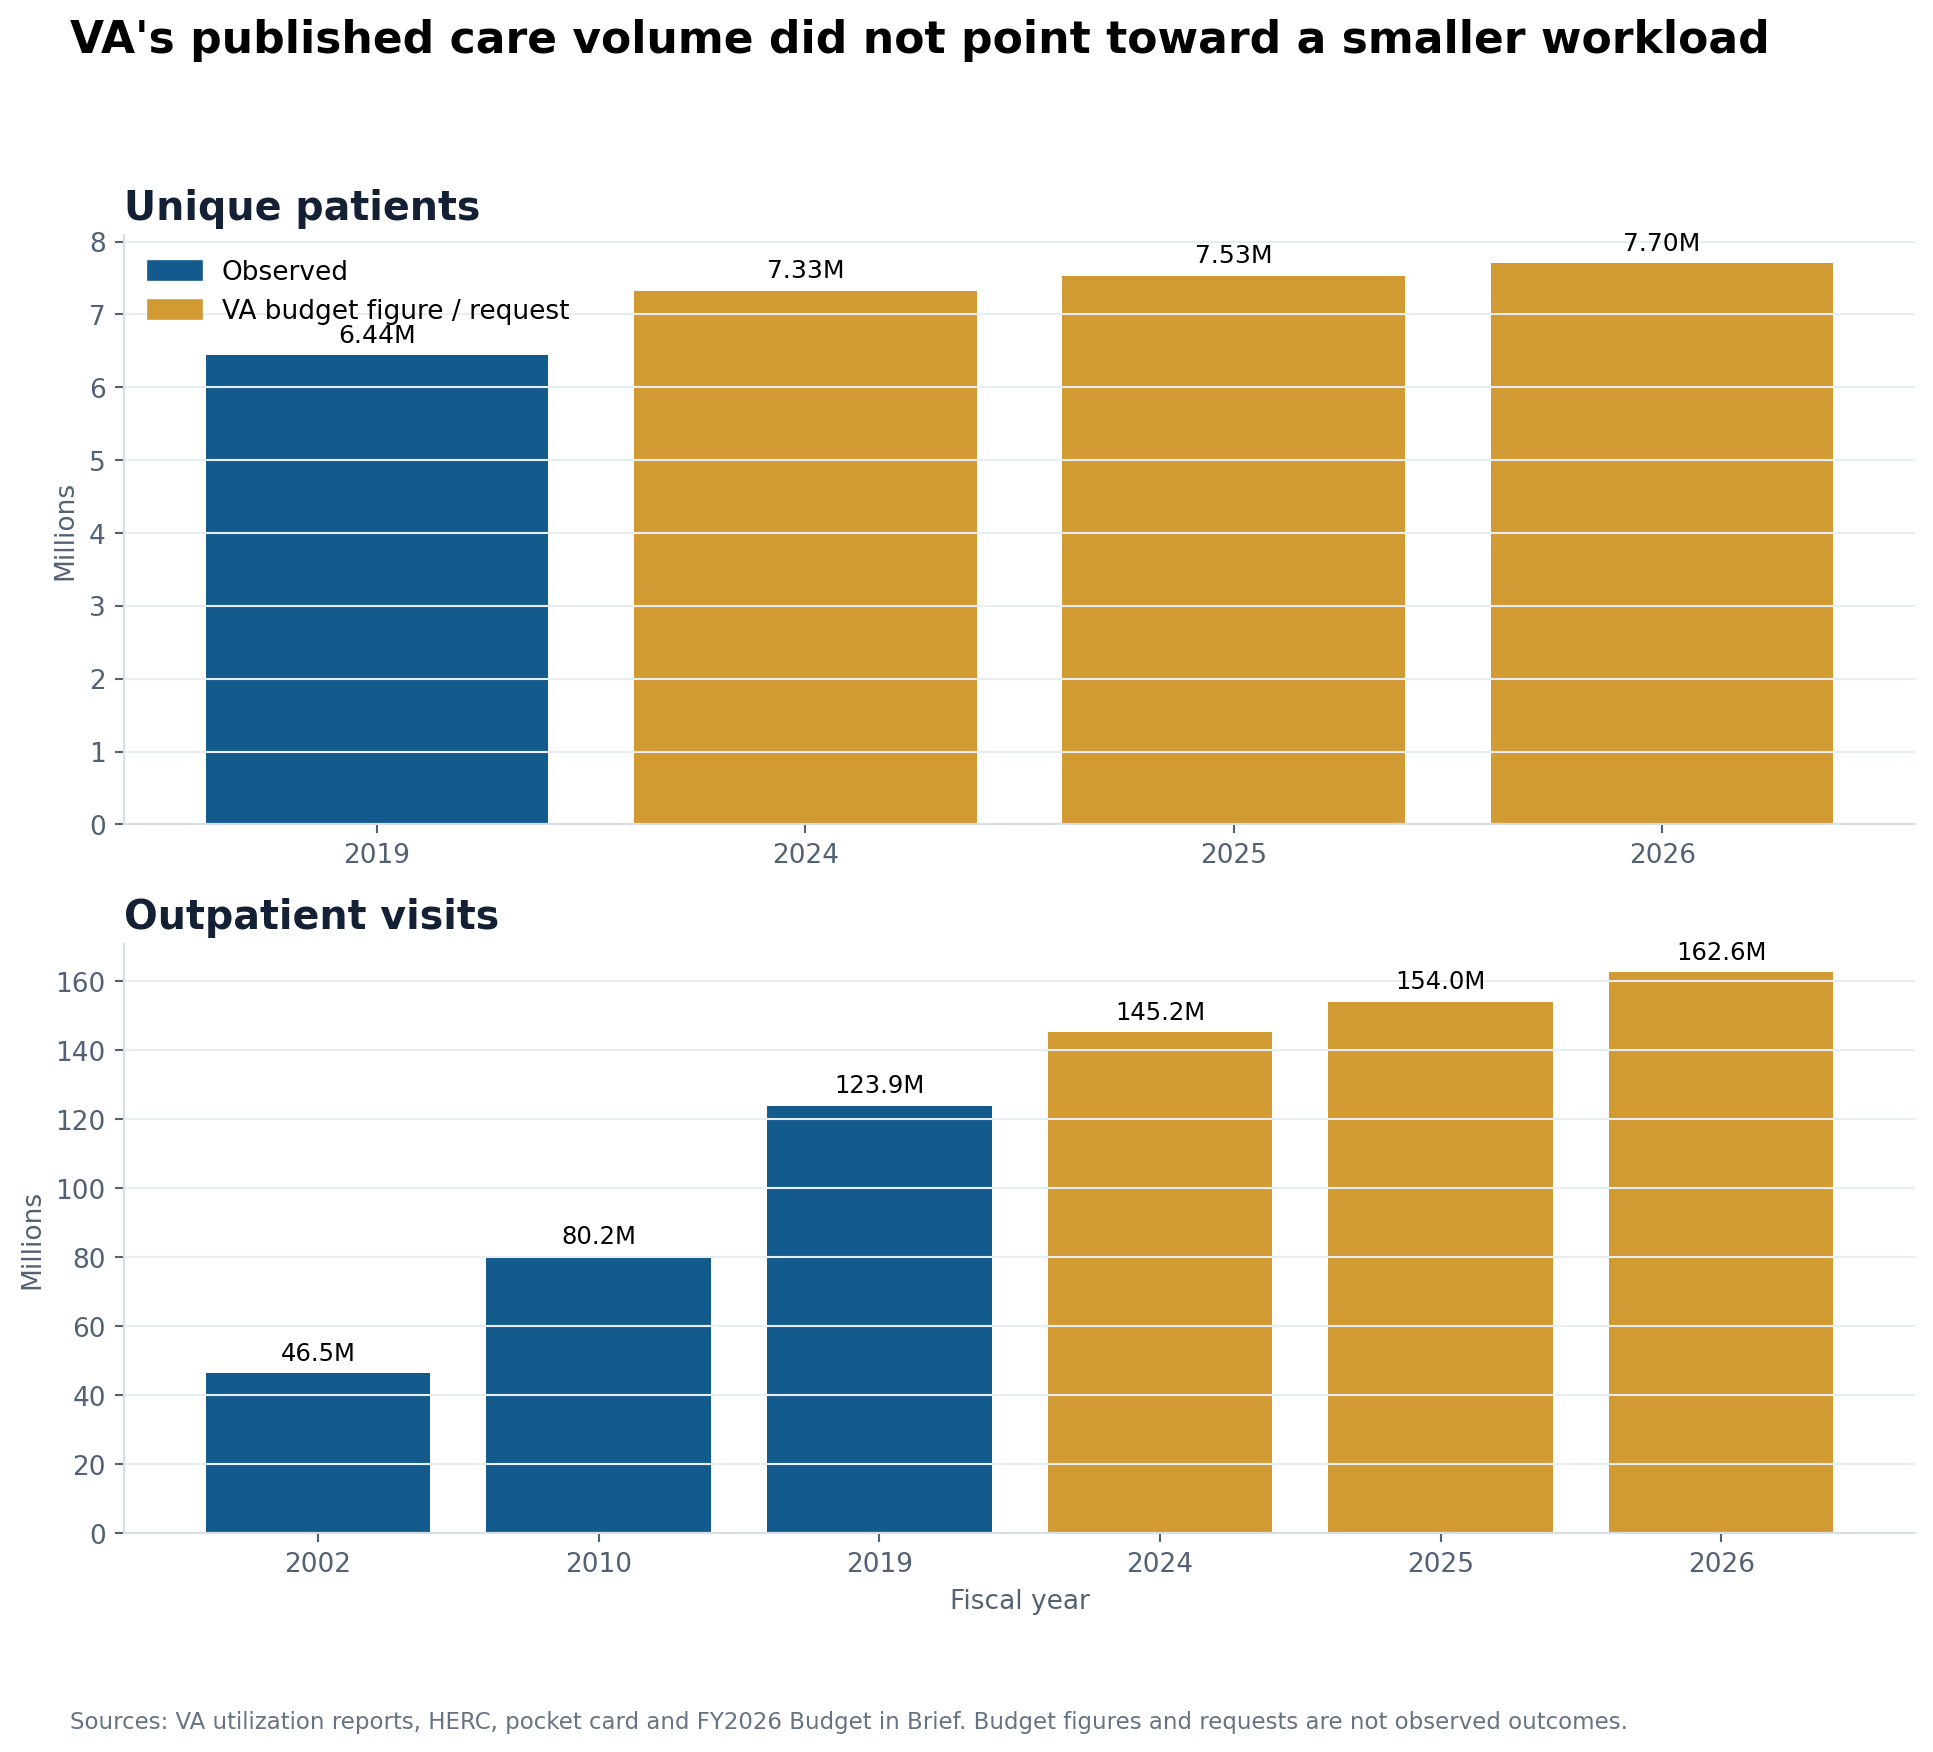
The blue and gold bars cannot be treated as one continuous audited series. Earlier figures come from VA utilization and research publications. The later values come from a budget document, and the 2026 values are requests or forecasts rather than completed-year results. Definitions can also change. The chart is a demand-direction comparison, not a precise productivity calculation.
Dividing visits by federal headcount would create a tempting but misleading ratio. A visit can occur in a VA facility or through community care. One veteran can generate many encounters. Some work is performed by contractors or trainees who do not appear in OPM headcount, while federal employees perform scheduling, authorizations and oversight for care delivered elsewhere. The public data do not support a claim that each remaining employee became a specific percentage more productive.
What the sources do support is narrower: VA did not publish a plan built around fewer patients or fewer outpatient visits as VHA federal employment declined.
Community care moved treatment, not all of the work
VA increasingly pays non-VA providers to treat eligible veterans. The Government Accountability Office reported that about 2.9 million veterans received community care in 2023. A later GAO review put the 2024 count at about 3.1 million.
That expansion adds clinical capacity outside the federal payroll. It is the strongest reason not to equate a federal headcount decline with an equal loss of available care.
It does not make federal workload disappear. VHA employees still determine eligibility, authorize care, prepare referrals, schedule or coordinate appointments, exchange records, process claims and oversee networks. GAO's community-care work found that most facilities in one reviewed region did not have recommended staffing for those functions in 2020. As of the agency's 2026 review, the staffing recommendation remained only partially addressed.
GAO's referral-coordination review also found mixed implementation. Some facilities reported faster scheduling after adopting referral coordination teams, while the watchdog identified gaps in policy, guidance and assessment. Community care can shorten a route to treatment in some circumstances, but its operation depends on administrative capacity inside VHA.
There is also a cost boundary. GAO reported a $149.5 billion fiscal 2025 estimate for VA medical care and a later request for an additional $6 billion. Federal payroll is only one part of that total. Community-care payments, contracts, pharmaceuticals, facilities and medical inflation remain even when federal employment falls. The available evidence does not establish that a smaller VHA workforce produced a smaller total bill.
VHA still cannot count every physician providing care
Physician staffing illustrates the limits of any federal-only total. In a 2017 review, GAO found that VHA counted more than 11,000 mission-critical employee physicians and about 2,800 fee-basis physicians, but did not have complete information on contract physicians or medical trainees. GAO recommended a process for counting every physician providing care.
That recommendation was still listed as open in January 2026. The gap matters in both directions. OPM's medical-officer decline does not count every doctor available to veterans, but VA also cannot publicly demonstrate that non-federal physicians replaced each lost employee physician.
This is why claims that VHA "lost" or "kept" a specific total of doctors need a population label. The 1,938 decline shown here is a change in OPM-covered VHA Medical Officer employees from January 2025 to June 2026. It does not include every contract, fee-basis, trainee or community physician.
The recruiting archive shows persistent demand
FederalHiringData's historical USAJOBS archive contains 707,993 distinct VHA announcements opened from March 2017 through Aug. 14, 2026. Nurses were the most frequently advertised occupation with 105,042 announcements. Social work had 55,448, medical support assistance 40,321 and medical officers 33,311.
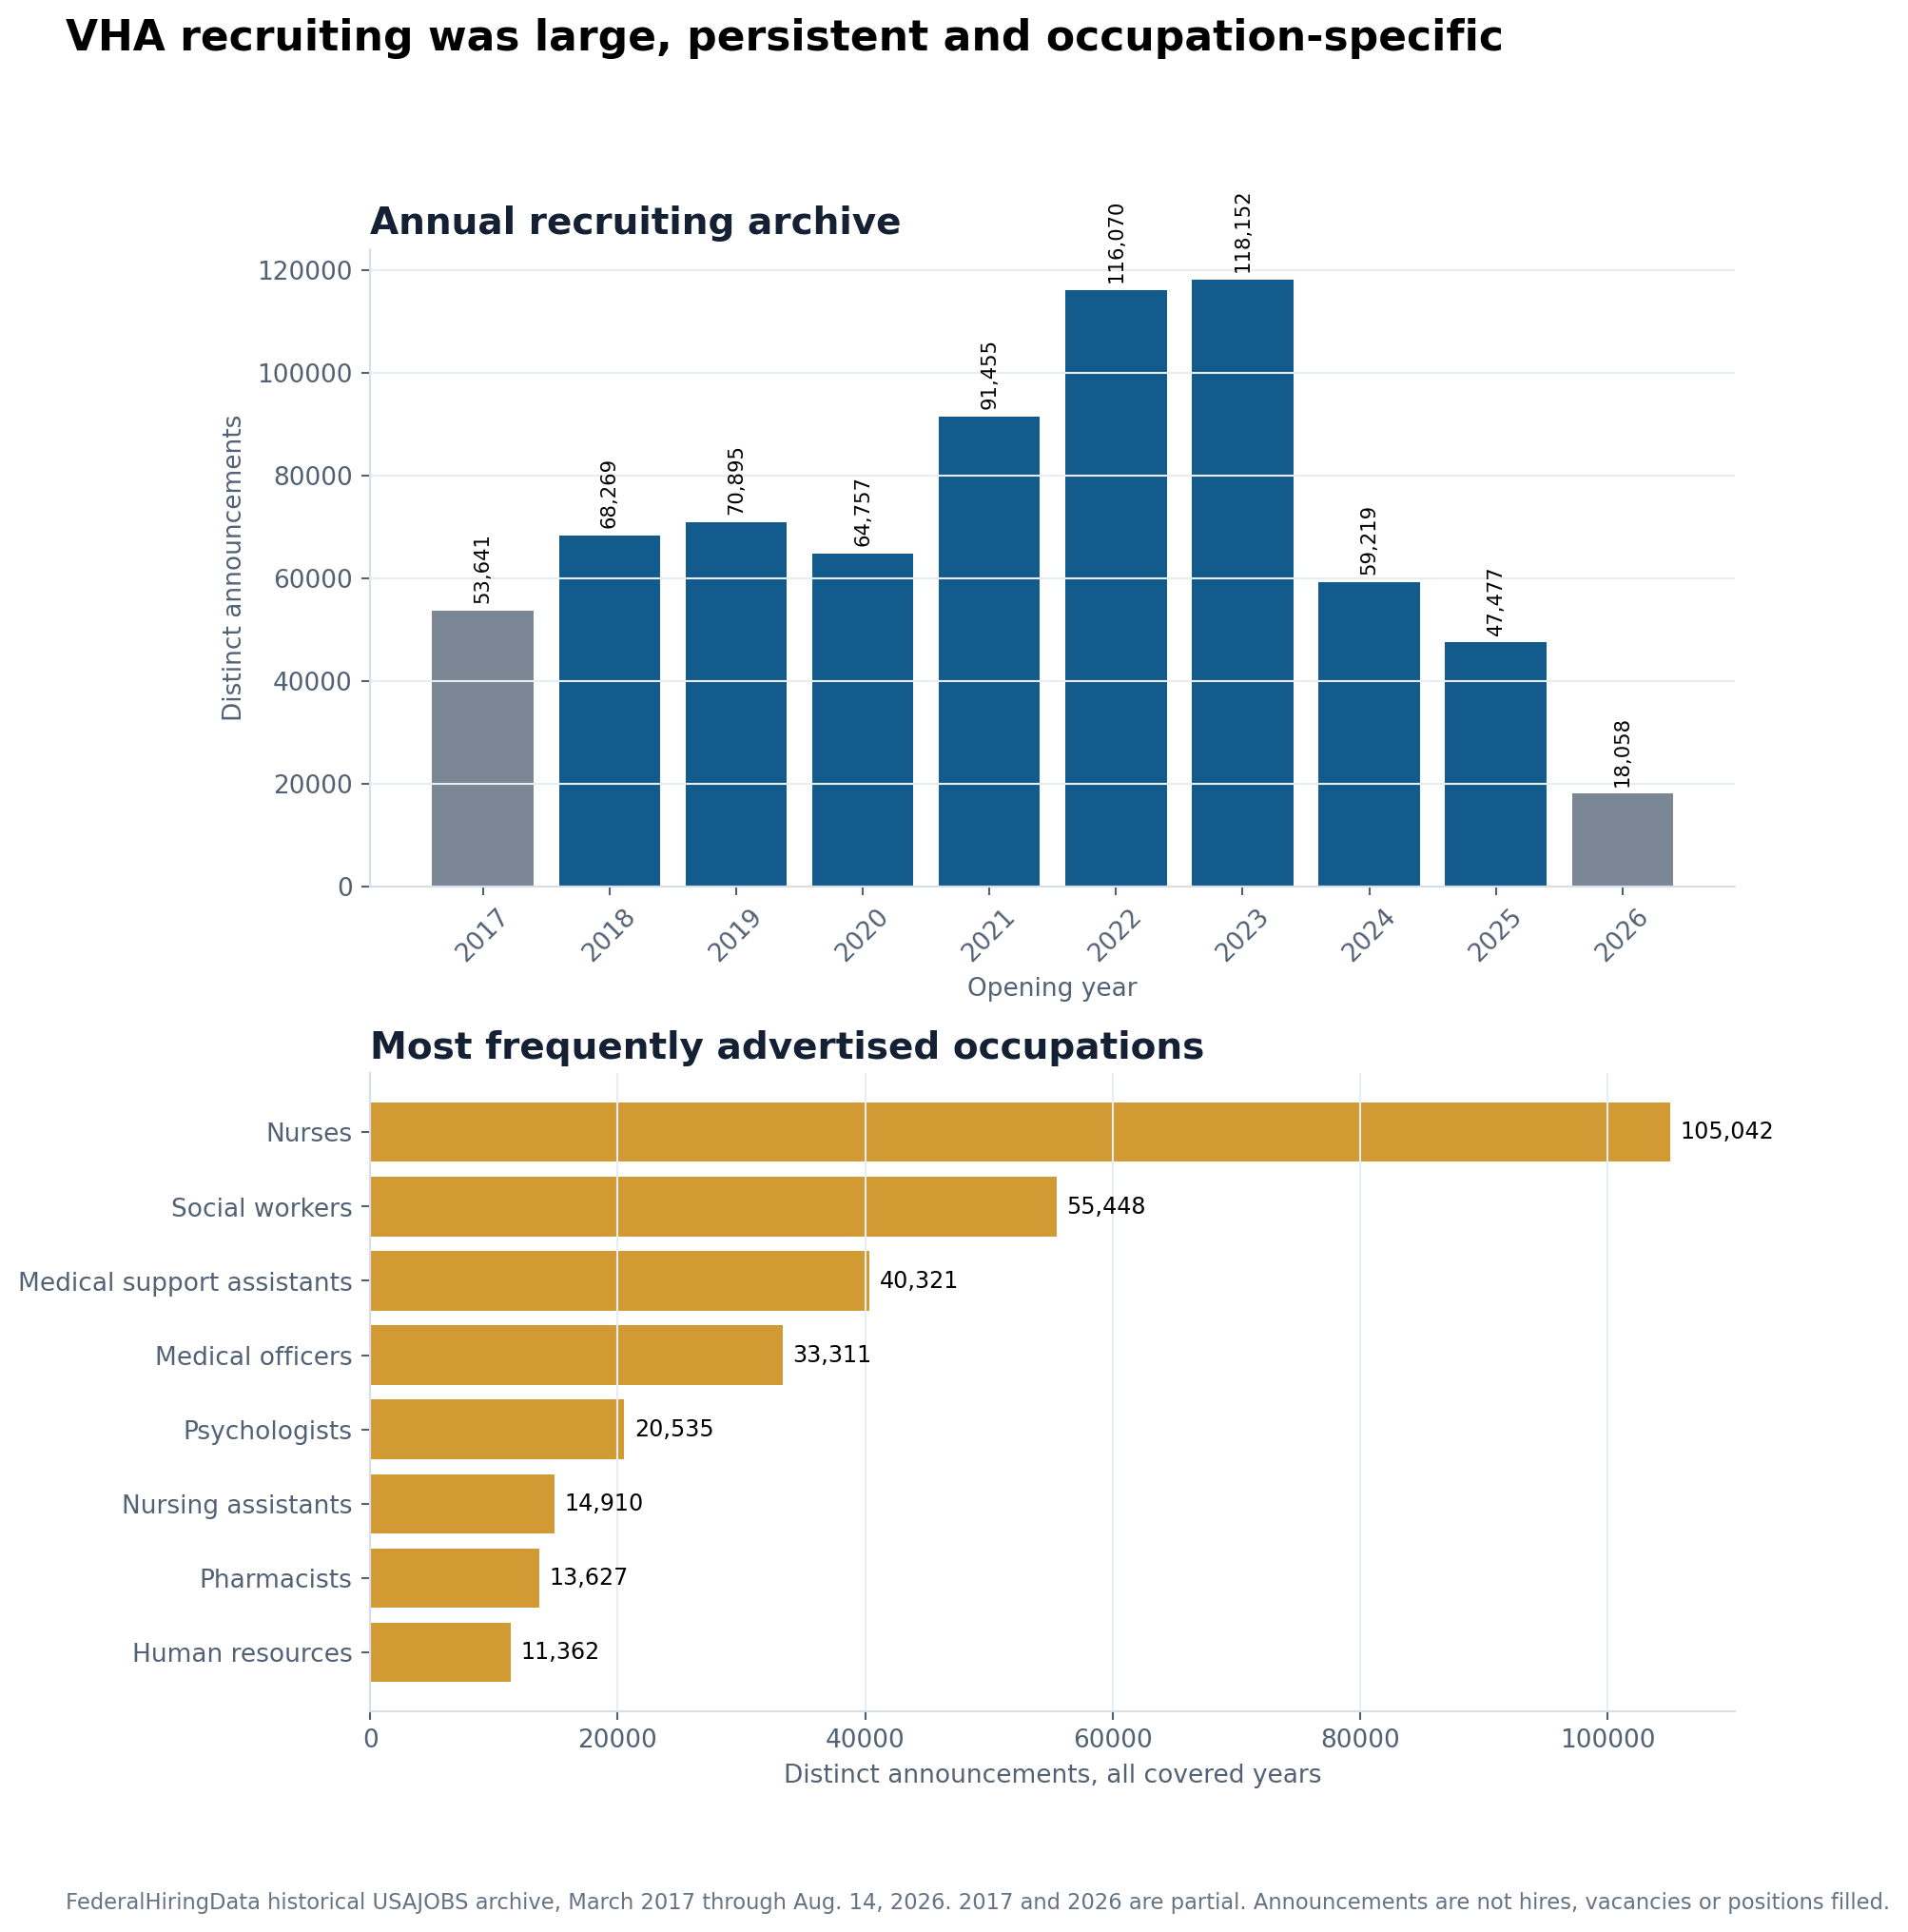
The annual archive peaked at 118,152 announcements opened in 2023, then fell to 59,219 in 2024 and 47,477 in 2025. The first and last years are incomplete. The 2017 archive begins in March, and 2026 runs only through Aug. 14.
Related research
Put this finding in context

Data investigationsAugust 21, 2026
DOE Has an $8 Billion Cleanup Mission. Its Federal Oversight Workforce Fell to 856.
DOE's nuclear-cleanup office lost one-third of its federal staff in two years while engineering, contracting and safety-related vacancies widened.
Data investigationsAugust 18, 2026
FEMA's Public Workforce Count Fell 22% as GAO Warned of Readiness Risks
FEMA had 5,793 fewer covered civilian employees in June 2026 than in January 2025. GAO says the agency cut staff without the workforce planning needed to assess mission capacity.
| Occupation | Distinct archived announcements | Median advertised window | Median normalized maximum salary |
|---|---|---|---|
| Nurse | 105,042 | 14 days | $125,145 |
| Social Work | 55,448 | 18 days | $103,176 |
| Medical Support Assistance | 40,321 | 14 days | $56,526 |
| Medical Officer | 33,311 | 38 days | $300,000 |
| Psychology | 20,535 | 20 days | $136,063 |
| Pharmacist | 13,627 | 21 days | $154,314 |
Salary figures are medians of normalized announcement maximums where usable salary data were available. They are not starting salaries, offers or guaranteed pay. Medical professions can use special salary authorities and pay systems that do not map neatly to the General Schedule.
An announcement is not a hire. One posting can cover multiple vacancies or locations, create a standing register, be canceled or close without a selection. The archive does not observe every applicant, offer, entry-on-duty date or retention decision. It shows repeated recruiting activity for the same occupations that remain central to VHA care.
The recruiting record therefore answers a different question from OPM headcount. USAJOBS shows that VHA repeatedly sought nurses, social workers, support assistants and physicians. OPM shows that the covered federal workforce in several of those occupations still ended June 2026 below January 2025.
Wait times require a separate test
The workforce and workload trends create a reasonable question about access, but they do not answer it. VA uses dozens of systems for appointments, referrals and wait-time reporting. In its 2026 scheduling review, GAO said only three of nine prior recommendations had been fully implemented.
Without a consistent facility-level link between staffing changes and appointment outcomes, attributing a wait-time movement to workforce reductions would be speculation. National averages could also conceal service lines or locations moving in opposite directions.
The evidence to watch next is more specific: same-service wait measures, canceled appointments, referral-processing time, community-care authorization backlogs, vacancy and time-to-hire data, overtime and contract spending at facilities with documented staffing changes. Those measures would help distinguish a manageable rebalancing from a capacity problem. The current public data establish pressure and uncertainty, not a causal verdict.
A smaller federal core facing a larger care plan
The most defensible conclusion is neither that VHA collapsed nor that outside providers made the federal reduction immaterial.
VHA remained larger in June 2026 than it was in September 2019. Community care supplied treatment through thousands of non-VA providers. The federal workforce continued to include more than 91,000 nurses and 28,000 medical officers in the selected OPM series.
At the same time, VHA's covered workforce fell by 28,342 after December 2024. Losses reached clinical, mental-health, scheduling and recruiting functions. Separations exceeded accessions in 15 of 18 months. VA's own budget publication forecast more patients and outpatient visits, while GAO continued to identify gaps in community-care coordination, physician counting, scheduling measures and budget estimation.
That combination leaves VHA with a smaller federal core responsible for a care system that is not publicly expected to get smaller. Whether the model works will depend not only on how many clinicians deliver care, but on whether VA can hire, coordinate, measure and account for the combined federal and non-federal workforce around them.
Readers can browse current federal health jobs, compare agency hiring data, explore federal workforce statistics and read more FederalHiringData investigations.
Methodology and limitations
Workforce: FederalHiringData queried OPM legacy FedScope snapshots and monthly Federal Workforce Data for VHA subelement VATA. The long series uses comparable September observations from 2000 through 2025, with June 2026 shown as the latest monthly point. Recent changes use modern monthly observations. OPM covered employment excludes contractors, trainees, fee-basis physicians, community providers and some shared services. It should not be treated as VA's complete care-delivery workforce.
Occupations and personnel actions: Occupational comparisons use selected VHA-coded OPM series from January 2025 to June 2026. Series affected by clear centralization or shared-service transfers were excluded. Accessions and separations are personnel actions, not a unique-person roster, and do not exactly reconcile monthly headcount stocks.
Patients and visits: Historical utilization figures come from official VA quick facts, the Health Economics Resource Center and VA pocket cards. Later figures come from VA's Fiscal Year 2026 Budget in Brief. The 2026 patient and visit figures are budget projections, not completed-year observations. Enrollment, unique patients and visits measure different populations and cannot be substituted for one another.
Community care and operations: Community-care counts, staffing findings, physician-count limitations, scheduling findings and budget context come from GAO reports linked in the article. The sources do not permit a causal estimate of the effect of workforce reductions on wait times, quality or total spending.
Recruiting: USAJOBS analysis uses distinct control numbers in the FederalHiringData historical archive. Coverage for this article begins in March 2017 and runs through Aug. 14, 2026. Announcements are not hires, applicants, vacancies, selections or positions filled. Salary maximums were annualized only when the source units supported normalization and remain announcement ceilings rather than promised compensation.
Image: The hero image is an official Department of Veterans Affairs VA Careers photograph published in June 2025. It shows a registered nurse at a VA medical facility.
Continue reading
More from FederalHiringData

Data investigationsAugust 18, 2026
IRS Workforce Fell 29% as GAO Warned of Filing-Season Risks
The IRS had 29,663 fewer covered civilian employees in June 2026 than in January 2025. GAO says workforce-planning gaps and post-filing pressures pose risks to future operations.

Data investigationsAugust 21, 2026
National Park Visits Rose 13%. September Staffing Fell 17%.
The park system still builds a summer workforce, but same-month OPM data show a thinner permanent base beneath 323 million annual visits.

Data investigationsAugust 19, 2026
The Federal Workforce Shrunk by 286,000. DOGE's Savings Are Harder to Prove
FederalHiringData finds a 12.4% workforce contraction and an estimated $22.8 billion decline in annualized basic-pay cost, while the public savings ledger remains incomplete.
Federal Hiring Data Weekly
Get the biggest federal workforce changes in your inbox.
Subscribe to Federal Hiring Data Weekly for federal hiring trends, salary data, agency movements, and original investigations, with email confirmation before delivery.