August 21, 2026
National Park Visits Rose 13%. September Staffing Fell 17%.
The park system still builds a summer workforce, but same-month OPM data show a thinner permanent base beneath 323 million annual visits.
By Evan Mercer
Published August 21, 2026Last edited August 21, 2026
America's national parks recorded 323,014,305 recreation visits in 2025. That was not a record, but it was still 13% more visits than the park system recorded in 2000.
The federal workforce serving those parks moved the other way. The National Park Service had 19,315 employees in the Office of Personnel Management's September 2025 snapshot, down from 23,198 in September 2000. That is a decline of 16.7% across the same 25-year span.
Put the two measures together and annual visits per September employee rose from about 12,324 to 16,723, an increase of 35.7%. That ratio is not a productivity score. It does not count unique visitors, hours worked by volunteers, concessioner employees, contractors or the different demands of a wilderness park and an urban memorial. It is a workload-context measure, and it shows how far use and federal staffing have diverged.
There is an important trap in the more recent numbers. Park staffing is highly seasonal. A large fall-to-winter decline can be normal as temporary appointments expire. It would be wrong to describe every employee leaving after summer as a permanent workforce cut.
The seasonal explanation is real, but it does not explain away the decline. September 2025 staffing was 11.7% below September 2024. June 2026 staffing was 15.6% below June 2024. Those are comparisons of the same month, not a summer peak against a winter trough. Beneath the seasonal hiring cycle, the Park Service is operating with a thinner permanent base.
That distinction should frame every workforce comparison that follows.
Park use and staffing moved in opposite directions
The long view starts with two official series. National Park Service visitor statistics report recreation visits across the system. OPM employment data count covered federal employees in the NPS subelement. September is used for the historical workforce comparison because the legacy FedScope series supplies consistent September snapshots and because holding the month constant reduces seasonal distortion.
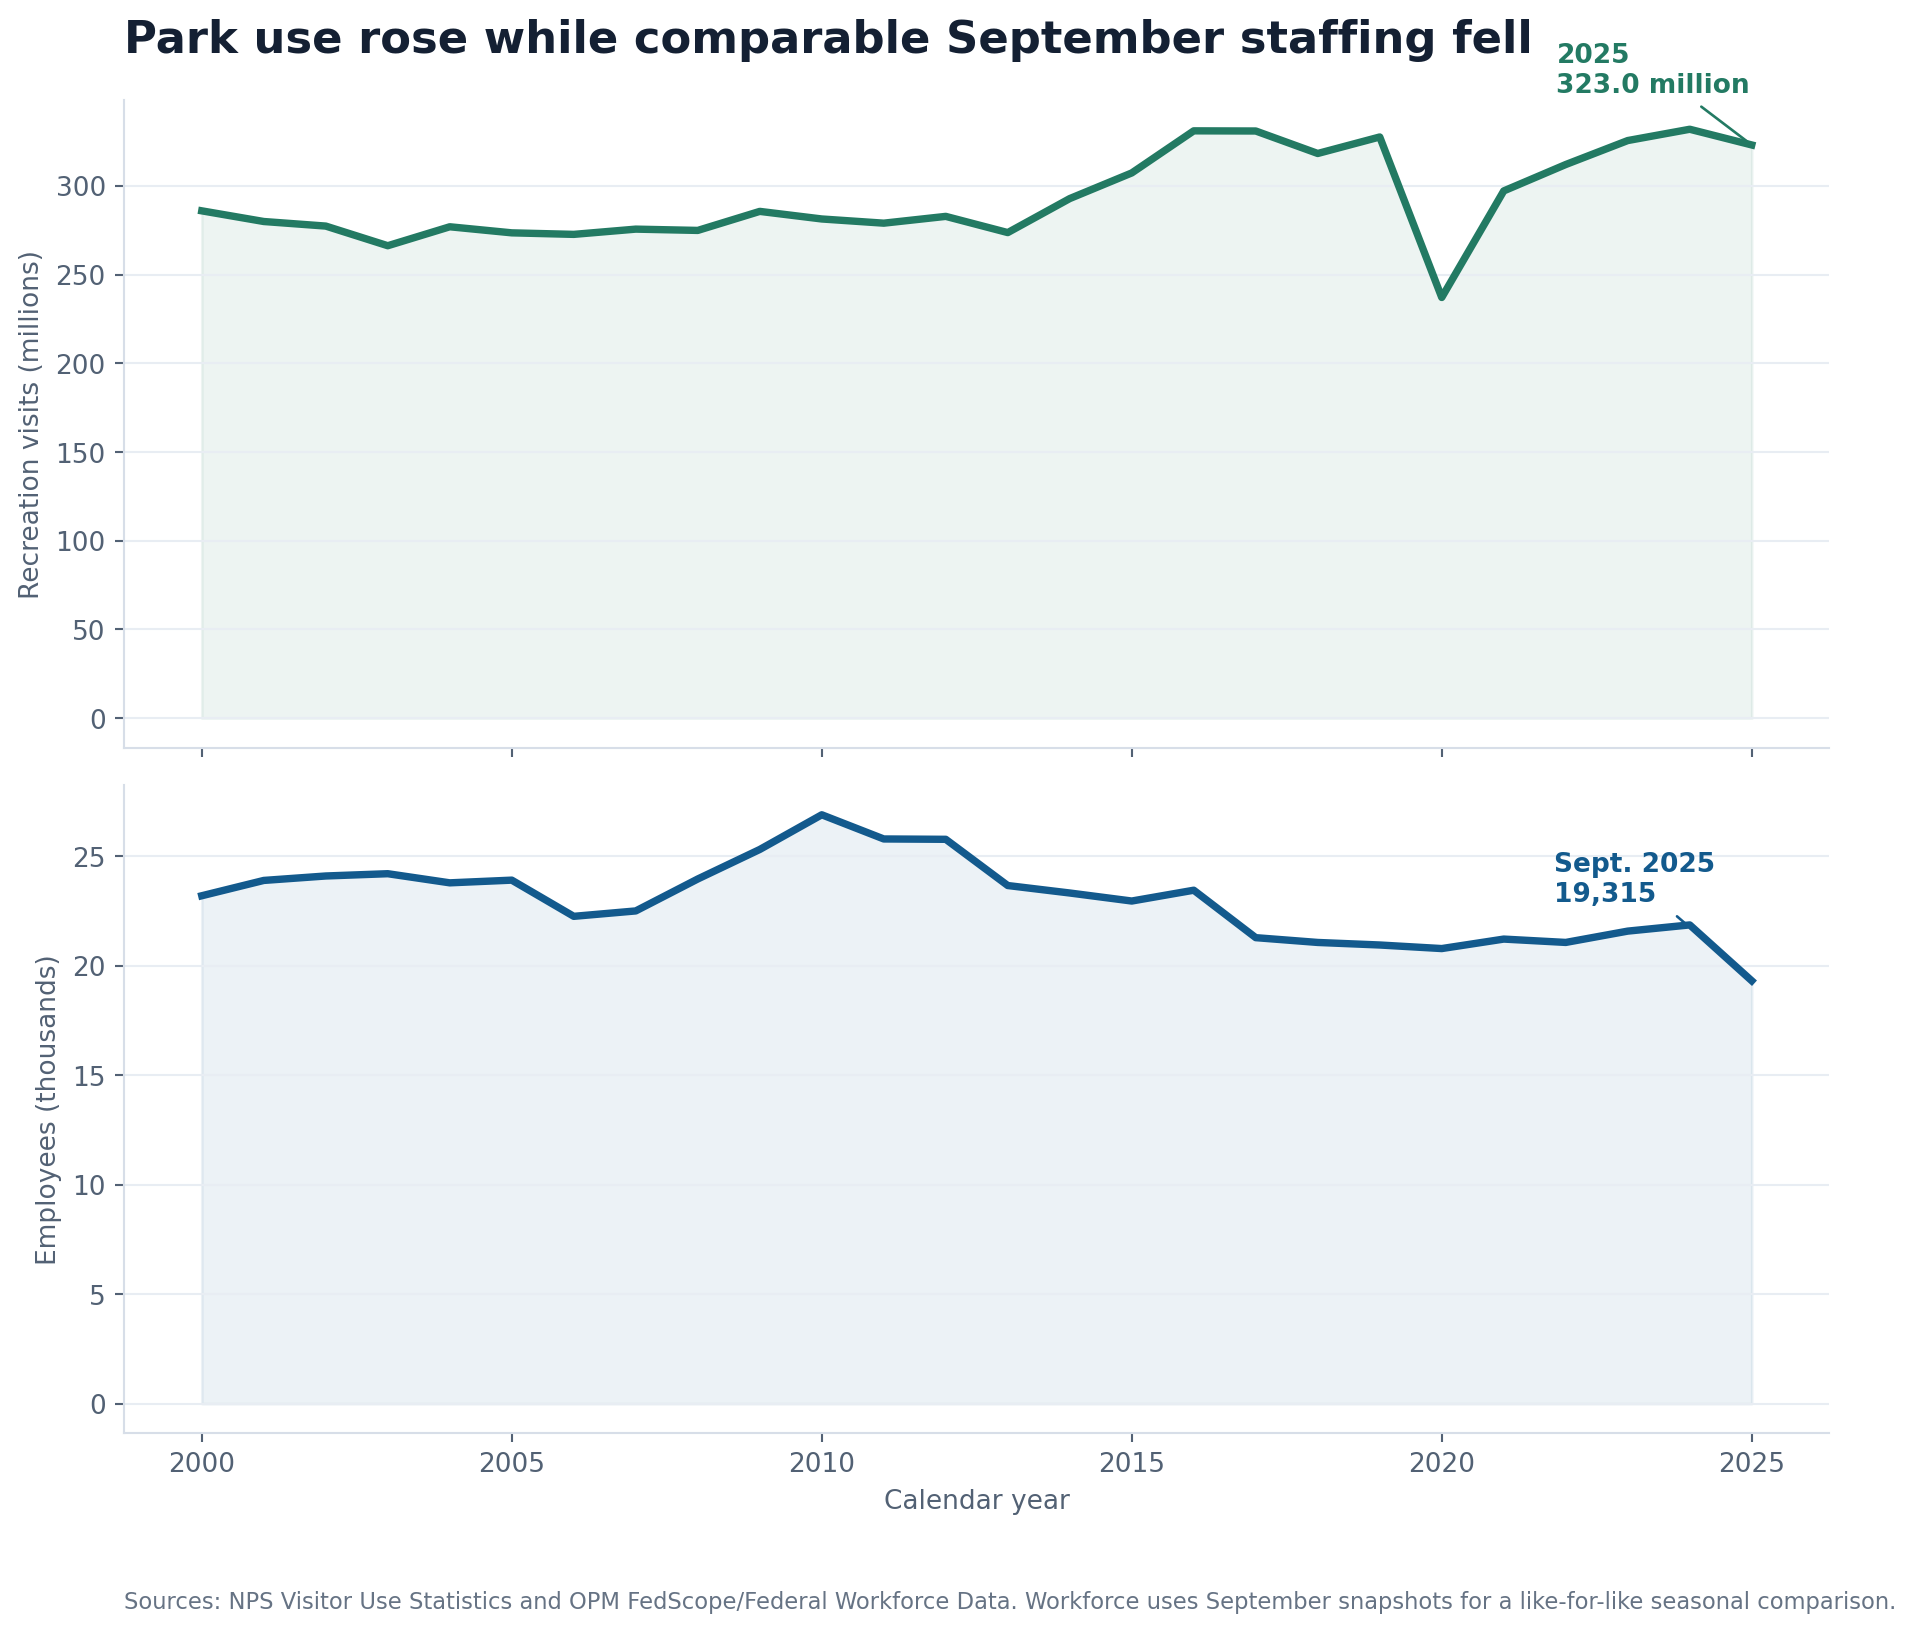
The paths were not smooth. Recreation visits fell during the early 2000s, climbed above 330 million in 2016 and 2017, and collapsed to 237 million during the pandemic in 2020. They rebounded to a record 331.9 million in 2024 before easing 2.7% in 2025.
NPS staffing reached 26,897 in the September 2010 snapshot. It then declined through much of the following decade. September headcount was 22,957 in 2015, 20,786 in 2020, 21,866 in 2024 and 19,315 in 2025.
| Year | Recreation visits | September NPS employees | Visits per September employee |
|---|---|---|---|
| 2000 | 285,891,275 | 23,198 | 12,324 |
| 2005 | 273,488,751 | 23,911 | 11,438 |
| 2015 | 307,247,252 | 22,957 | 13,384 |
| 2024 | 331,863,358 | 21,866 | 15,177 |
| 2025 | 323,014,305 | 19,315 | 16,723 |
The 2025 visitor total represented more than one count of park entries. NPS also reported 1.387 billion recreation visitor hours, 13.0 million overnight stays and 26 parks with record visitation. Its March 2026 release said 406 parks reported visitation figures.
A rising ratio is a warning light, not a productivity score
The annual visits-per-September-employee ratio rose 35.7% between 2000 and 2025. It reached a high in 2025 because visitation remained near historically elevated levels while September staffing dropped sharply.
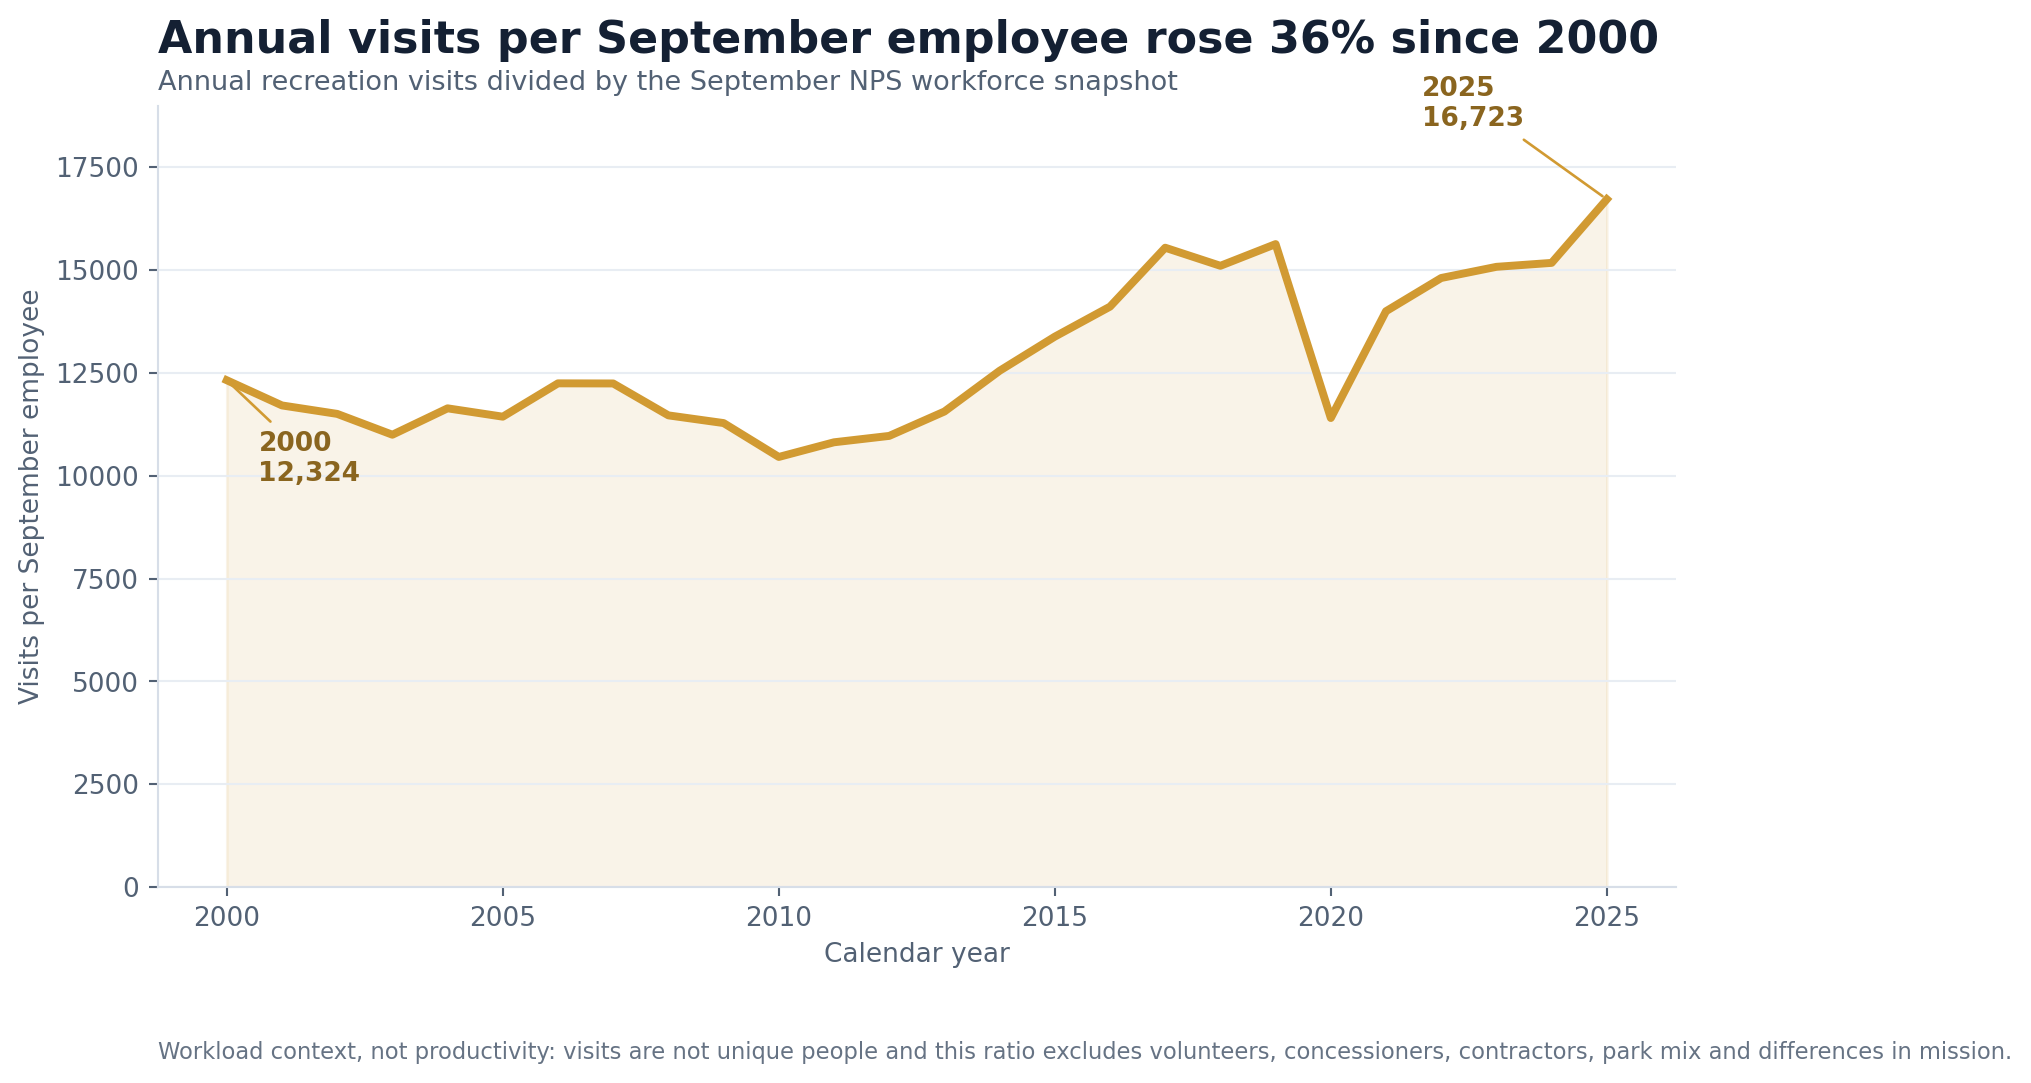
The ratio places staffing beside public use, but it does not prove that every employee handled 36% more work. Recreation visits are not unique people, and a scientist, archeologist, mechanic and emergency responder do not share one interchangeable workload. Federal headcount also excludes volunteers, concessioners, contractors, partners and shared-service employees.
The ratio therefore cannot answer whether staffing is adequate. It can answer a narrower historical question: there were fewer federal NPS employees in the comparable September snapshot for every unit of annual recreation use than there were 10, 20 or 25 years earlier. A comparable 30-year workforce series was not available in the sources used here, so this analysis does not pretend to extend the staffing ratio to 1995.
The seasonal trap is visible in every year
Park employment normally expands ahead of summer and contracts in the fall. Monthly OPM data make that cycle unmistakable. In 2024, NPS employment rose from 17,406 in January to 22,505 in July. In 2025 it rose from 17,904 in January to 20,311 in July, then fell to 15,156 in December. In 2026 it rose from a February low of 13,832 to 18,888 in June, the latest month available.
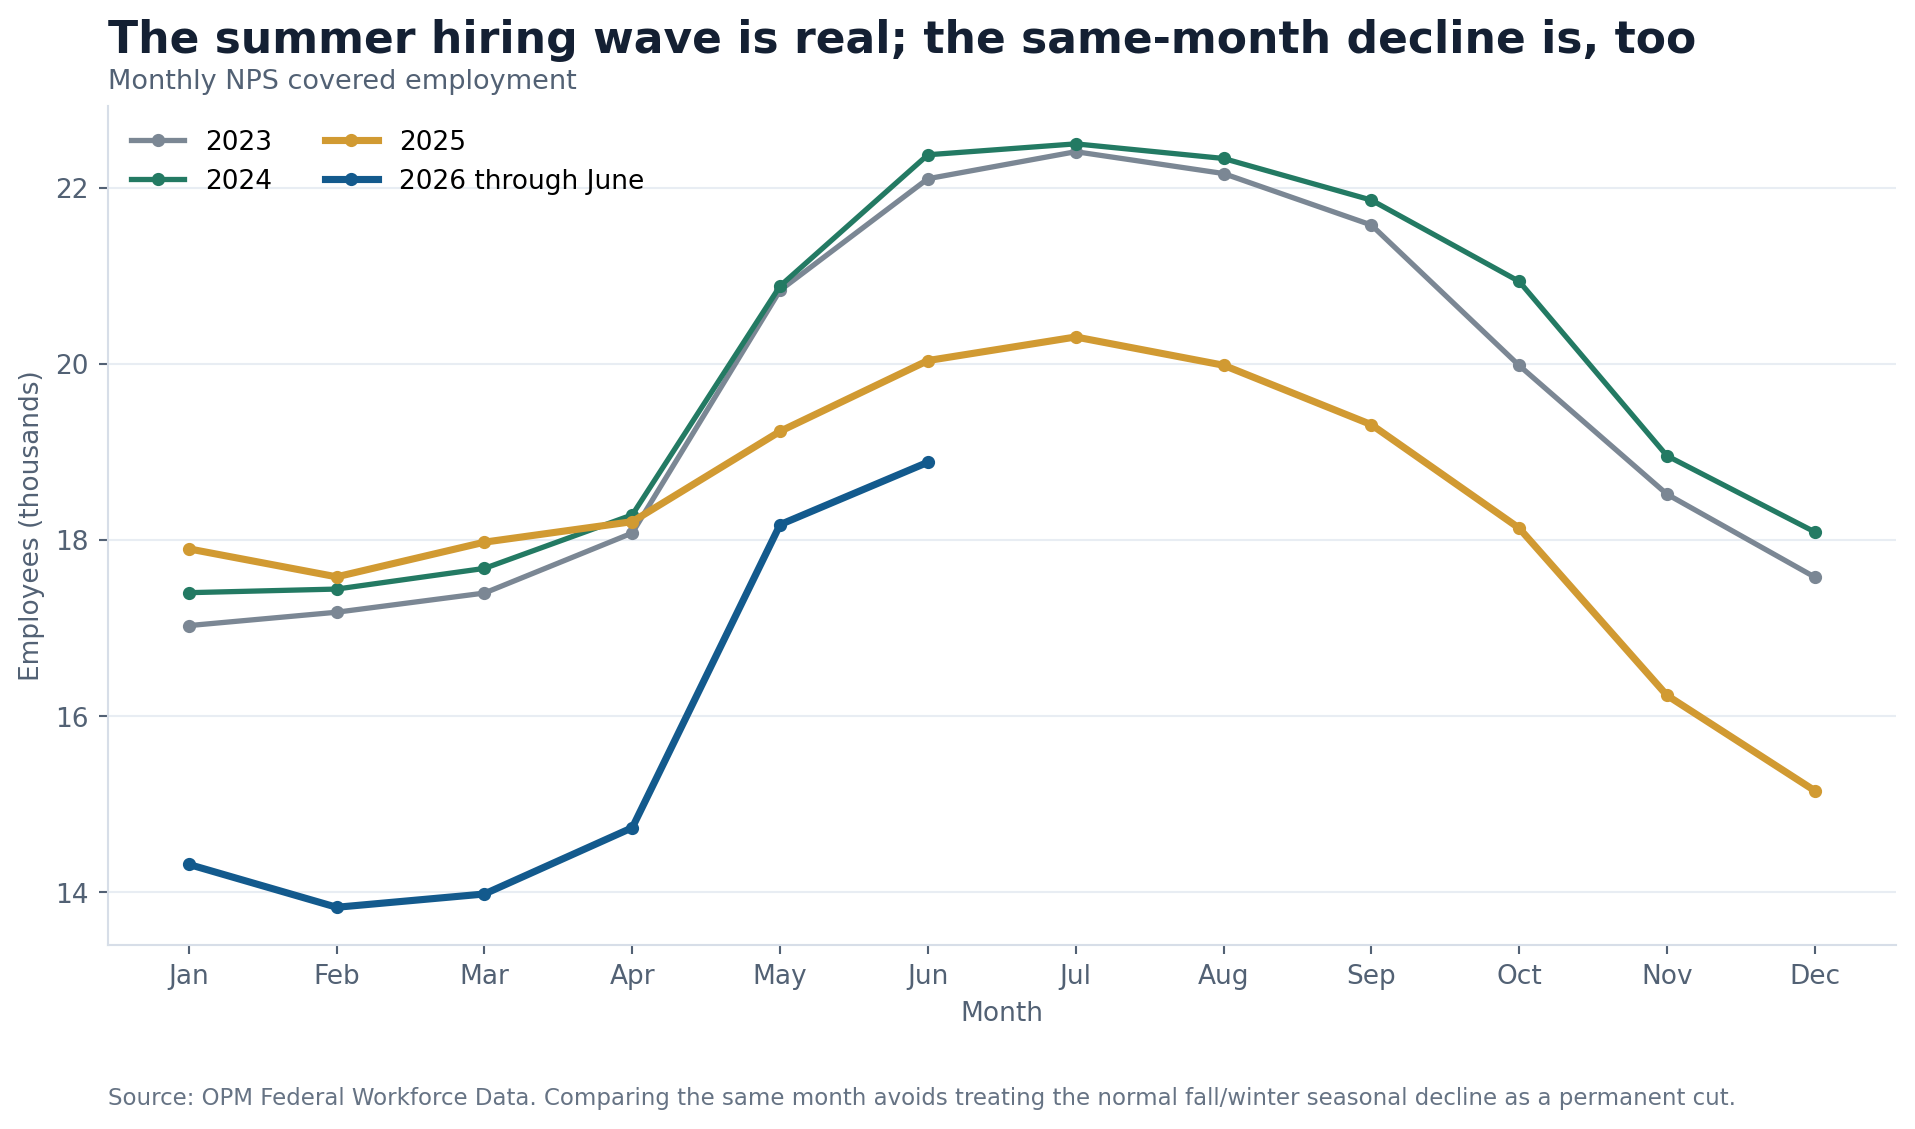
That is why an October-to-January comparison can mislead. Seasonal appointments expire after peak use, and a raw separation count includes those departures.
The Government Accountability Office reported that NPS employment fell from 18,096 at the end of 2024 to 15,156 at the end of 2025. Its table counted 7,625 employee separations and calculated a 45.9% separation rate. Read without occupational and calendar context, that rate could sound as though nearly half the permanent workforce walked away. GAO did not make that claim.
FederalHiringData's current OPM extraction contains 8,463 NPS separation actions for 2025, a different count because it reflects a different data release and extraction date. Of those actions, 4,783, or 56.5%, were classified as termination of an expired appointment or other termination. Another 982 carried OPM's deferred-resignation indicator. And 5,173 actions, 61.1% of the annual total, occurred from September through November, when the seasonal workforce normally winds down.
Those categories cannot be added to GAO's total or treated as a one-for-one roster of people. They do establish the central caution: much of the gross flow was seasonal or otherwise distinct from permanent attrition.
The proper test is same-month headcount. On that measure, September 2025 was still 2,551 employees below September 2024. June 2026 was 3,493 below June 2024 and 1,155 below June 2025. Normal seasonality explains the shape of each year. It does not explain the lower level of the later curves.
The permanent base carried more than the net loss
Appointment status shows where the same-month decline concentrated.
In June 2024, NPS had 16,344 employees in permanent appointment categories and 6,037 in nonpermanent categories. By June 2026, the permanent count had fallen to 12,542, a reduction of 3,802, or 23.3%. Nonpermanent headcount increased by 309 to 6,346.
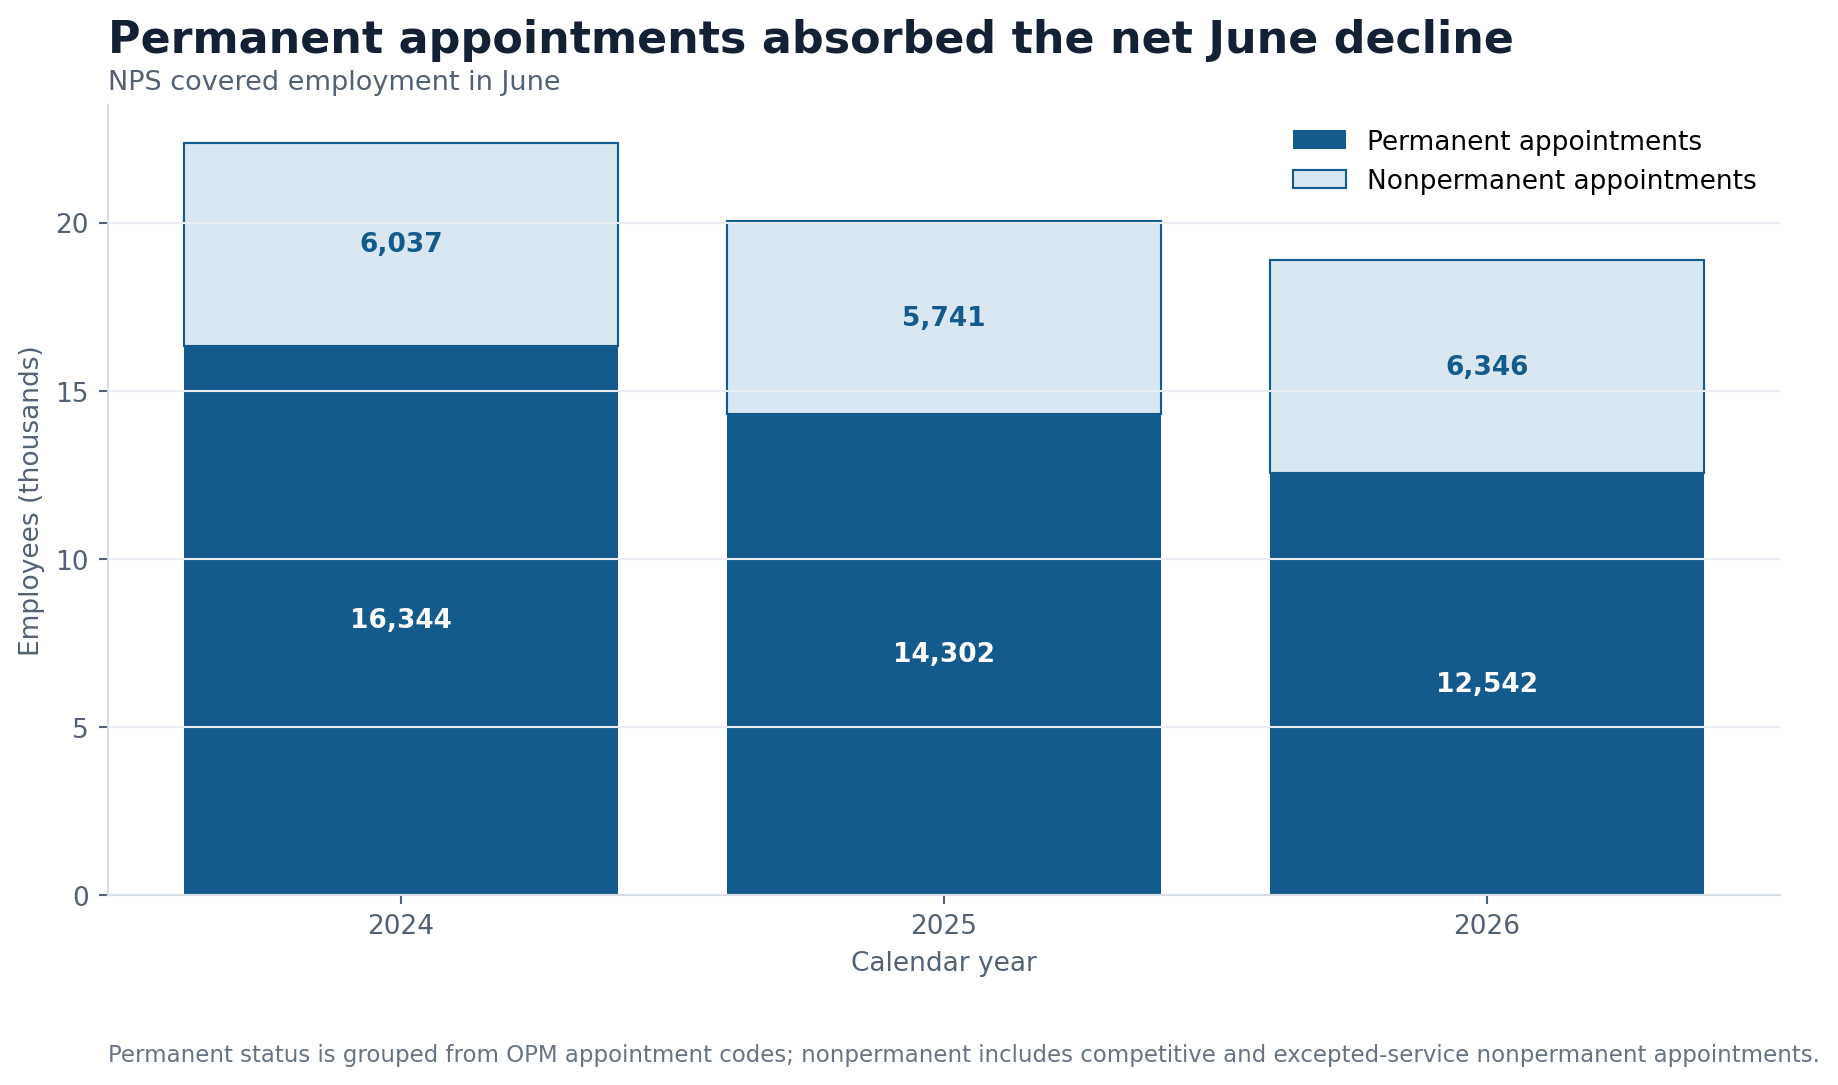
The permanent decline was larger than the net workforce decline because nonpermanent hiring offset part of it. That does not make nonpermanent employees less valuable. Seasonal and temporary workers are central to operating parks during peak months. It does mean that the Park Service entered the 2026 summer with a different composition: a smaller permanent base and a slightly larger nonpermanent component than two years earlier.
Permanent employees often carry year-round responsibilities, institutional knowledge, supervision and specialized duties before and after the visitor season. Appointment type alone cannot reveal whether a particular unit lost a supervisor, a scientist or an administrative specialist. But it is a stronger signal of structural change than the fall separation total.
The 2026 hiring wave was substantial. OPM records show 1,759 NPS accessions in April and 3,170 in May, followed by 501 in June. The agency rebuilt much of its summer headcount after the February trough. The question is not whether seasonal hiring happened. It is whether that wave was enough to replace the permanent capacity lost since 2024.
Resource science and visitor services show the clearest losses
Selected occupational series help identify which NPS-coded functions changed between June 2024 and June 2026.
The Natural Resources Management and Biological Sciences series fell from 637 to 435, a loss of 202, or 31.7%. Biological Science Technicians declined by 57. Guides fell by 55, archeology by 37, maintenance mechanics by 36 and facility operations by 28.
Federal Hiring Data Weekly
Get the biggest federal workforce changes in your inbox.
Subscribe to Federal Hiring Data Weekly for federal hiring trends, salary data, agency movements, and original investigations, with email confirmation before delivery.
Park Ranger moved in the other direction, increasing by 36 to 4,369, less than 1%. Laboring also rose by 36 and custodial work by 24.
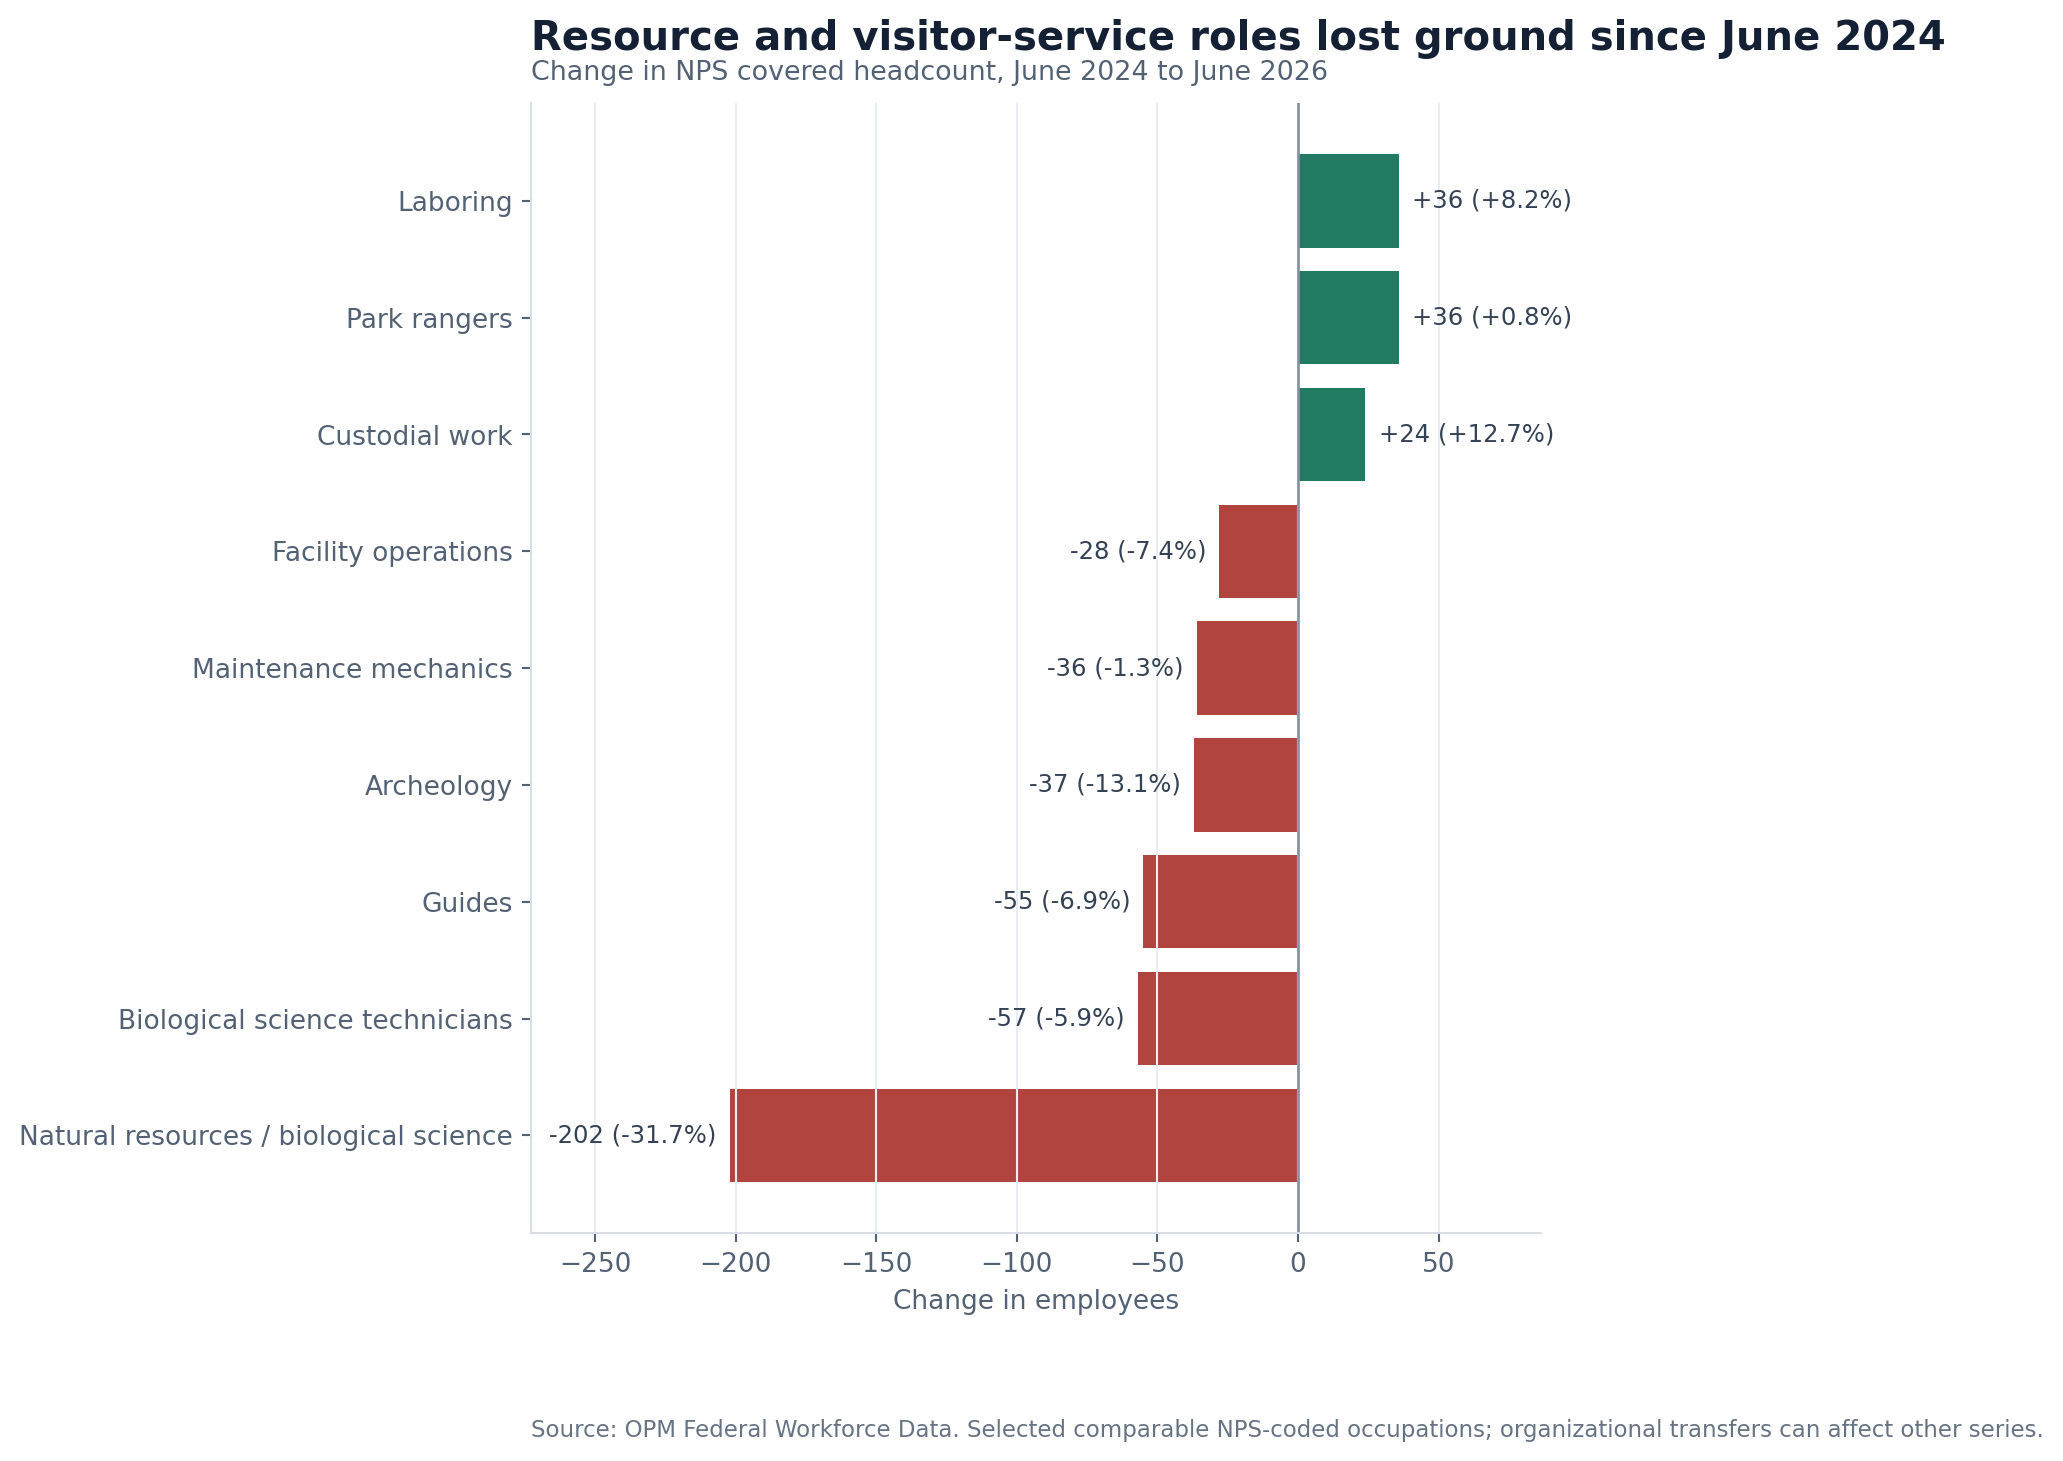
These changes suggest uneven pressure rather than a uniform retreat. The core Park Ranger series held roughly steady in the June comparison, while resource science, guides, archeology, maintenance and facility operations lost staff. That matters because high visitation can strain more than public-facing ranger work. Trails, buildings, water systems, cultural resources and biological monitoring all require labor whether or not a visitor sees it.
The chart is intentionally selective. Human resources, contracting and information technology counts were affected by Interior shared services, while wildland fire classifications were affected by the 2026 U.S. Wildland Fire Service reorganization. Treating those coded declines as vanished work would overstate the evidence, so they are excluded.
Occupational series also describe employees, not outcomes. A lower scientist count does not prove that a monitoring program failed, and a stable ranger count does not prove every park had enough protection or interpretation staff. The series identify where comparable federal headcount changed; park-level operational evidence is needed to say what followed.
Yellowstone shows the labor system behind one crowded park
Yellowstone offers a useful 2026 case because NPS publishes both visitation and a bounded workforce description.
The park recorded 4,762,988 recreation visits in 2025, its second-highest annual total. NPS reported 958,706 visits in July 2026 and 2,635,384 through the first seven months, down 2% and 1%, respectively, from the same periods in 2025. Those are same-period comparisons for one park, not a substitute for a complete 2026 national total.
The 2026 Yellowstone Resources and Issues Handbook says about 750 NPS employees work there during the summer peak: roughly 360 permanent and 390 seasonal. It also says about 3,200 people work for concessioners at peak.
| Yellowstone measure | Published figure | What it represents |
|---|---|---|
| 2025 recreation visits | 4,762,988 | Entries counted under NPS visitor-statistics rules |
| Peak-summer NPS workers | About 750 | Federal workforce at one park during its high season |
| Permanent NPS workers | About 360 | Year-round appointment context in the handbook |
| Seasonal NPS workers | About 390 | Peak-season federal capacity |
| Concessioner workers at peak | About 3,200 | Non-federal lodging, food, retail and other services |
The table explains why a national federal headcount ratio should not be mistaken for total labor available to visitors. At Yellowstone, concessioner employment is several times the peak federal count. That workforce provides essential visitor services, but it does not replace federal law enforcement, resource stewardship, emergency response, regulatory oversight or management authority.
Yellowstone is not a national average. Its value here is showing the layered labor system hidden behind a single visit count.
Volunteers extend capacity without replacing employees
NPS says more than 131,000 volunteers served in 2025. Its history of the Volunteers-in-Parks program reports that more than 123,000 volunteers donated over 3.7 million hours in 2023.
Those figures demonstrate scale, but they do not establish a clean trend in volunteers' share of operating capacity. NPS requires annual reporting of volunteer activities and hours, yet a comparable public systemwide series for every year in this workforce analysis was not located. Volunteer headcount also needs careful interpretation: NPS guidance says a recurring volunteer is counted once per fiscal year per unit, so one person serving at multiple parks can appear more than once in a system total.
The law and NPS program history draw another boundary. Volunteers support interpretation, visitor services, resource work and many other activities, but they are not supposed to displace paid employees. They also are not interchangeable with commissioned law enforcement officers, trained emergency personnel, engineers or specialists carrying federal authority.
Grand Canyon's official statistics provide one local example. The park reported 427 NPS staff in fiscal 2024 and 369 in fiscal 2025, a decline of 58. It separately reported 619 volunteers contributing 28,479 hours in fiscal 2025.
That is meaningful help. It is not 619 full-time employees, and it cannot show that volunteer labor replaced the 58-person staff decline. The counts belong in adjacent columns, not one combined workforce total.
Related research
Put this finding in context

Data investigationsAugust 21, 2026
VHA's Federal Workforce Fell by 28,342. Its Care Forecast Kept Rising.
VA's health workforce contracted after late 2024 even as patient, visit and community-care demands remained large. The losses reached clinical and coordinating roles.
Data investigationsAugust 19, 2026
Social Security Has 85% More Beneficiaries per Worker Than in 2000
Social Security added 25 million beneficiaries while losing 9,600 full-time permanent workers. Recent service gains show what technology changed—and what a thinner workforce still risks.
The recruiting archive shows persistence and seasonality
FederalHiringData's historical USAJOBS archive contains 43,344 distinct National Park Service announcements opened from March 2017 through Aug. 14, 2026.
Park Ranger was the largest occupational series with 6,341 announcements. Maintenance Mechanic followed with 5,401, while biological science, guide, laboring, clerical and facility occupations also recurred.
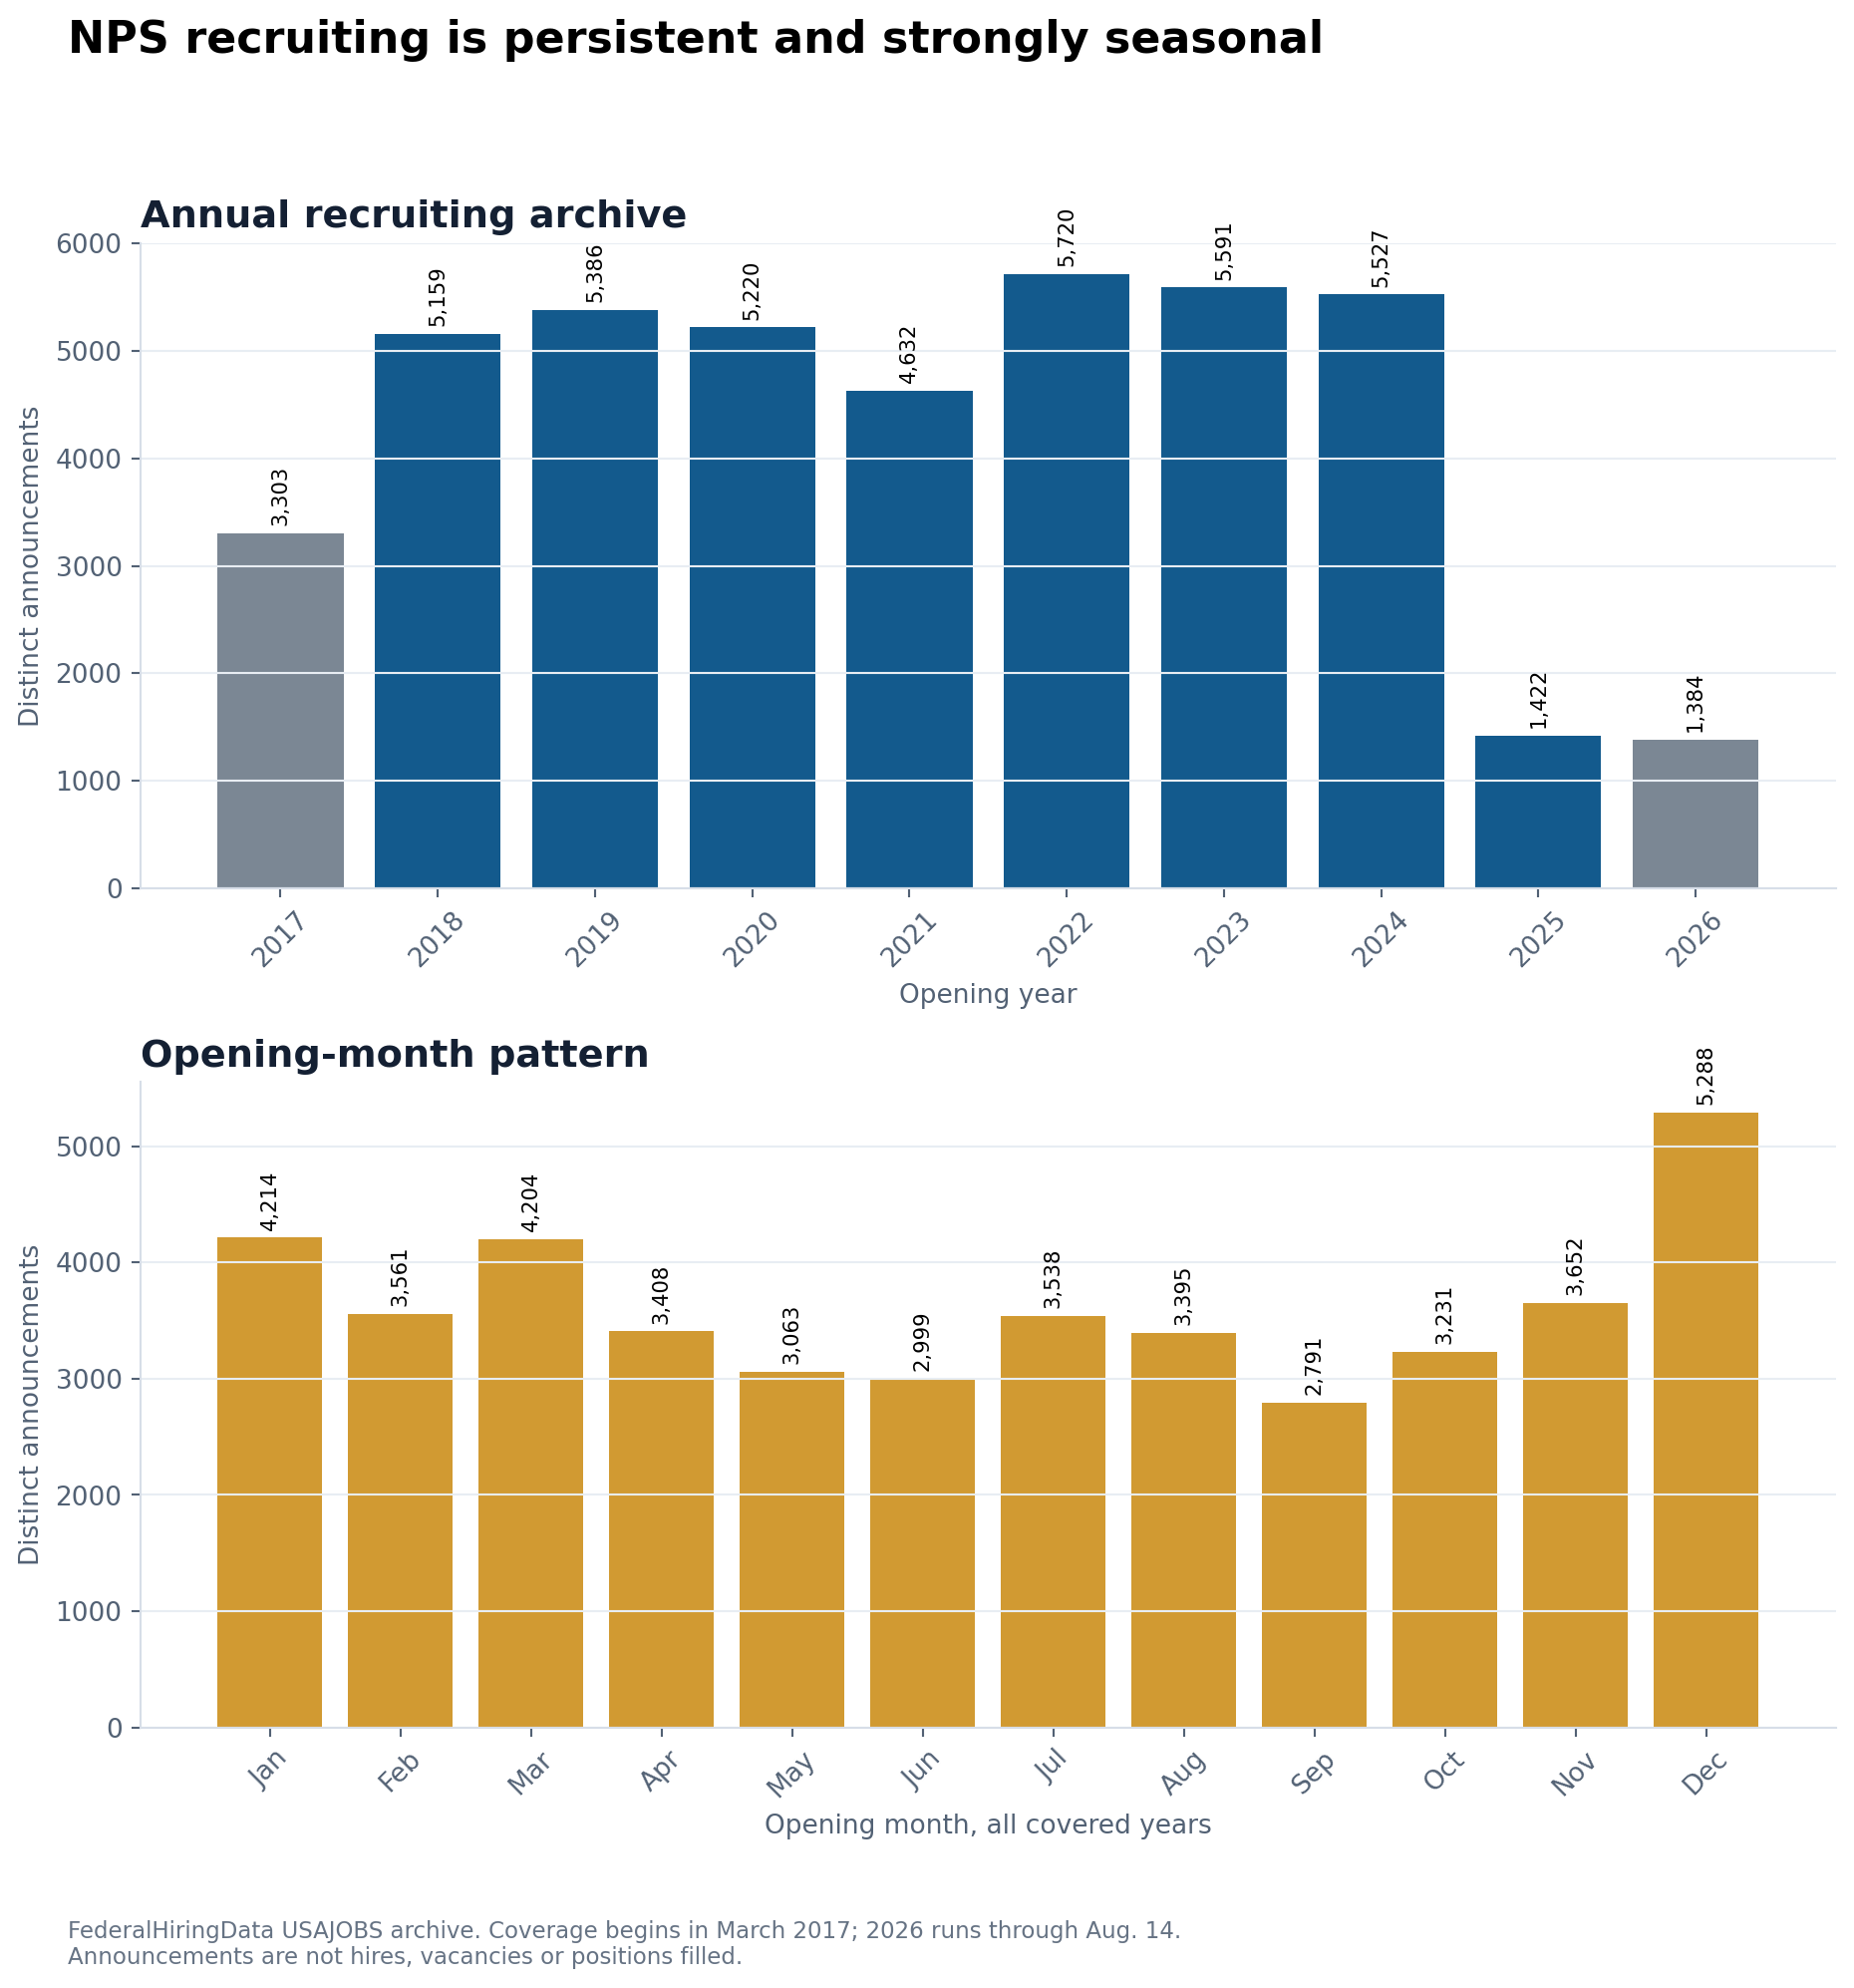
The opening-month pattern is strongly seasonal. December produced 5,288 distinct announcements across the covered archive, more than any other month, followed by January and March. Those postings often recruit ahead of the next warm-season operating cycle. The pattern is consistent with the accession wave visible in OPM data several months later.
The annual series should not be read as a hiring count. One announcement can advertise several openings or locations, establish a register, be canceled, or close without a selection. FederalHiringData does not observe every applicant, offer, entry on duty or retention outcome. Coverage begins in March 2017, so the first year is incomplete; 2026 is also partial through Aug. 14.
The archive shows a recurring demand for rangers, maintenance workers, biological science technicians, guides and support staff. What changed after 2024 was the lower permanent base beneath that familiar recruiting cycle.
A summer workforce rebuilt on a thinner foundation
The national parks did not enter summer 2026 without workers. OPM data show more than 5,000 accessions in April and May, and total NPS employment climbed by more than 5,000 from February through June. Park rangers were slightly above their June 2024 count. Yellowstone's handbook describes hundreds of seasonal federal workers alongside thousands of concessioner employees.
The opposing evidence is just as clear. September 2025 staffing was 11.7% below the prior September. June 2026 staffing was 15.6% below June 2024. Permanent appointment headcount fell 23.3% over that two-year same-month comparison, while resource science, guides, archeology, maintenance and facility operations lost staff in selected comparable series.
That is the most defensible answer to whether the workforce kept up with 323 million visits: NPS still built a seasonal workforce, but it did so on a thinner federal and especially permanent foundation than it had two years earlier. Over 25 years, annual recreation use rose while comparable September staffing fell, leaving substantially more visits per federal employee in the context ratio.
The next evidence to watch is not a winter headcount by itself. It is whether September 2026 recovers toward earlier same-month levels, whether permanent appointment counts stabilize, and whether resource and facility occupations rebuild. Complete 2026 visitation will arrive later. Until those like-for-like measures are available, claims of either collapse or full recovery would run ahead of the data.
Readers can browse current federal jobs, compare agency data, explore federal workforce statistics and read more FederalHiringData investigations.
Methodology and limitations
Visitation: Annual recreation visits come from National Park Service Visitor Use Statistics and the IRMA service for 2000 through 2025. NPS defines recreation visits under park-specific counting procedures; they are visits, not unique people. The 2025 visitor-hour, overnight-stay and record-setting-park figures come from the agency's March 13, 2026 release. No complete 2026 systemwide total is used. Yellowstone's July and year-to-date figures are a same-period park case only.
Workforce: FederalHiringData queried OPM legacy FedScope employment snapshots and monthly Federal Workforce Data for NPS subelement IN10. The long-run comparison uses September observations from 2000 through 2025. Monthly and appointment analyses use January 2015 through June 2026. All recent change claims compare the same month across years. OPM covered employment can differ from NPS internal counts and from figures taken on a specific day.
Workload context: Annual recreation visits divided by September covered employment is a descriptive ratio, not a productivity or staffing-adequacy measure. It combines a full calendar year of visits with one workforce snapshot. It excludes visitor hours per task, park mix, volunteers, concessioners, contractors, partners, shared-service employees and differences in mission. It should not be used to rank individual parks or employees.
Appointment and occupation groups: Permanent appointments are grouped from OPM appointment codes for competitive, excepted and senior executive permanent categories. Nonpermanent categories are reported separately. Appointment type is not the same as work schedule, funding source or operational importance. Occupational comparisons use selected NPS-coded series that remain reasonably comparable. Series affected by clear organizational transfers or shared-service changes are excluded from the chart rather than described as eliminated work.
Separations: GAO's 7,625 separations and 45.9% rate come from GAO-26-108557. The current OPM extraction contains 8,463 actions because it reflects a different release and extraction timing. The two counts are not combined. Separation actions can include expired appointments, retirements, quits, transfers and deferred resignations; they are not equivalent to a count of permanent employees lost.
Volunteers and park cases: NPS systemwide volunteer figures come from its official FAQ and Volunteers-in-Parks history. Annual reporting rules allow one recurring volunteer to be counted once per unit. Yellowstone figures come from the official 2026 Resources and Issues Handbook and July visitation release. Grand Canyon figures come from the park's official statistics page. The park cases illustrate labor composition and are not selected to estimate a national average.
Recruiting: USAJOBS analysis uses distinct control numbers in the FederalHiringData historical archive. Coverage begins around March 2017 and runs through Aug. 14, 2026 for this analysis. Announcements are not hires, vacancies, applicants, selections or positions filled. One announcement can cover multiple openings or locations.
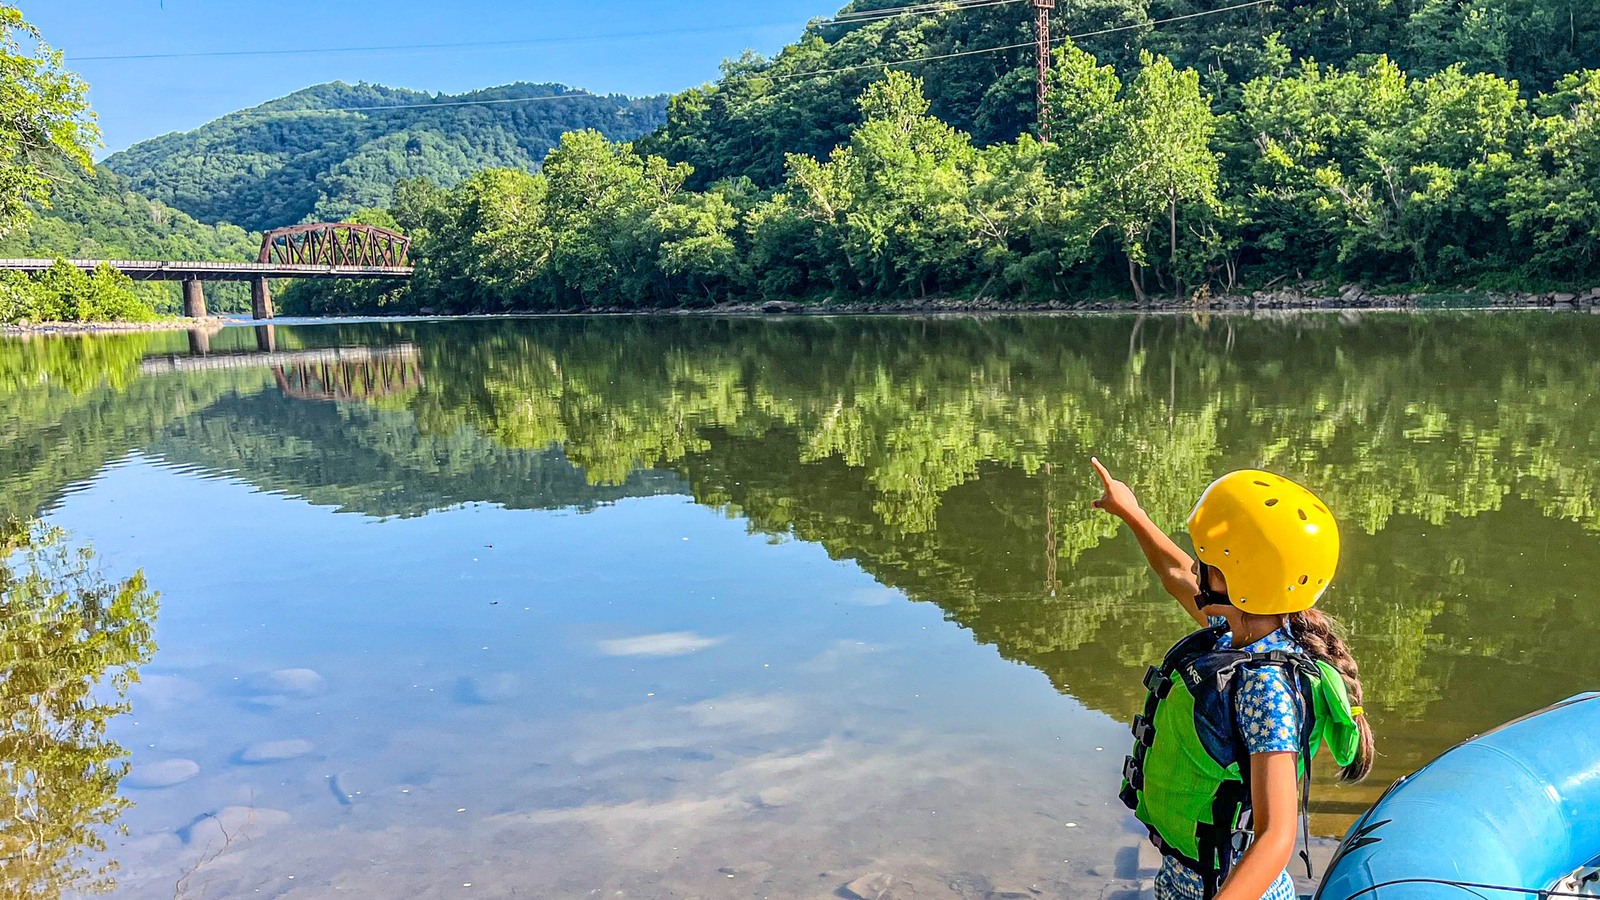
Image: The hero photograph shows rafting at New River Gorge National Park and Preserve, which NPS identified as a park with record visitation in 2025. It is an official National Park Service image credited to Victoria Stauffenberg.
Continue reading
More from FederalHiringData
Data investigationsAugust 18, 2026
FEMA's Public Workforce Count Fell 22% as GAO Warned of Readiness Risks
FEMA had 5,793 fewer covered civilian employees in June 2026 than in January 2025. GAO says the agency cut staff without the workforce planning needed to assess mission capacity.
Data investigationsAugust 18, 2026
IRS Workforce Fell 29% as GAO Warned of Filing-Season Risks
The IRS had 29,663 fewer covered civilian employees in June 2026 than in January 2025. GAO says workforce-planning gaps and post-filing pressures pose risks to future operations.
Data investigationsAugust 20, 2026
Federal Fire Staffing Rebounded in 2026. All of the Net Gain Came From Nonpermanent Appointments.
Interior built a new wildland fire service, but the Forest Service has not joined it. Federal records show the 2026 staffing rebound came entirely from nonpermanent appointments.
Federal Hiring Data Weekly
Get the biggest federal workforce changes in your inbox.
Subscribe to Federal Hiring Data Weekly for federal hiring trends, salary data, agency movements, and original investigations, with email confirmation before delivery.